Treating a 220 terawatt-hour tidal figure as electricity already generated gets the comparison wrong, and it points a coastal study at the wrong stretch of water. Wave energy is the energy in wind-driven surface waves; tidal energy is the energy in the rise and fall of the tide and in the flow of water those tides produce.
The Department of Energy’s resource table, drawn from its early-2021 summary “Marine Energy in the United States: An Overview of Opportunities,” lists a technical wave resource of 1,400 terawatt-hours a year in the U.S. exclusive economic zone and a technical tidal resource of 220 terawatt-hours a year. On that page, technical resource is the part of the theoretically available energy that a specific technology can capture. The same office’s basics page says the total available U.S. marine energy resource is equivalent to approximately 57% of all U.S. power generation in 2019. Both statements describe resource potential.
This comparison is compiled from those public pages, plus NOAA’s tide and wave facts and the Fundy Ocean Research Center for Energy (FORCE) learning notes on how tidal devices use height versus flow. It does not assess a project, a permit or a company. It sits in our wave energy section, with every explainer listed on the articles page.
Key points
- Surface waves, tidal streams and tidal range are three motions. A buoy, a tidal turbine and a barrage answer three different questions.
- NOAA calls the tide one of the most reliable phenomena in the world. The same tide still passes through slack water, so predictable does not mean a flat output.
- In the DOE table, 1,400 and 220 are technical resources in terawatt-hours per year. They share one denominator. They are not a year of generation.
What separates wave energy from a tidal stream and a tidal range?
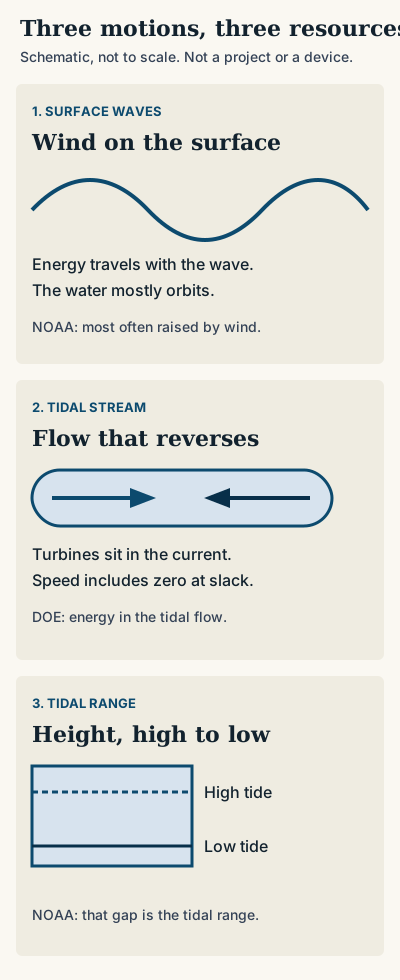
Wave energy, tidal-stream energy and tidal-range energy tap three different motions of the sea. Surface waves are an energy-carrying disturbance of the surface, most commonly raised by wind. A tidal stream is the flow of water driven by the tides. Tidal range is the difference in height between high water and low water. The device has to match the motion, because the resource number printed beside each one describes a different physical quantity.
| Question | Surface waves | Tidal stream | Tidal range |
|---|---|---|---|
| What is moving? | Energy in ocean surface waves. NOAA: the wave transmits energy; the water itself mostly does not travel with it. | Energy in the flow of water from the tides, which is the assessment DOE names “tidal streams.” | The height difference between high tide and low tide. NOAA calls that difference the tidal range. |
| What drives it? | Friction between wind and the surface, on NOAA’s waves page (updated September 23, 2026). The moon and sun raise a separate, very long wave: the tide. | The gravitational pull of the moon and the sun, with Earth’s rotation, on EIA’s tidal page. NOAA calls the resulting rise and fall one of the most reliable phenomena in the world. | The same astronomical tide. EIA says water levels near shore rise and fall by up to 40 feet in some places. |
| What does a machine respond to? | DOE’s basics page: some wave converters use buoys to take energy from the ocean’s vertical and horizontal movement. Working principles and the deep-water power formula are on the wave energy explainer. | DOE: turbines harness tides and currents. FORCE: an in-stream turbine uses the passing flow to turn a generator, in the same broad way a windmill uses air. EIA also describes a tidal fence, a row of vertical-axis turbines on the seabed. | FORCE: a barrage is essentially a dam across a tidal estuary and uses the head between high and low water. EIA: gates let a basin fill on the flood and empty through turbines on the ebb. A two-way system uses both directions. |
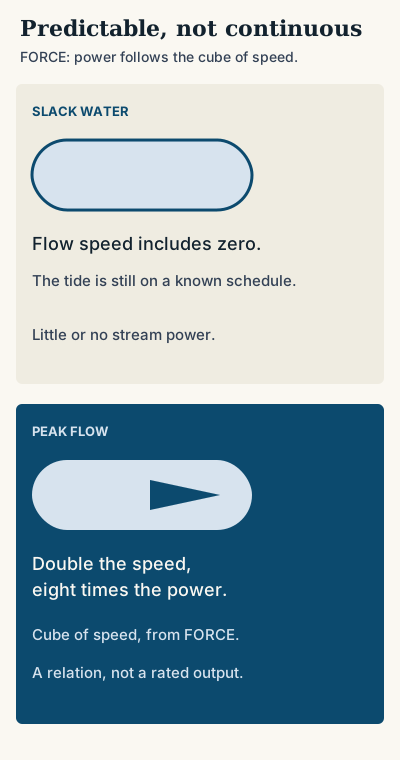
| Does the output stay on? | NOAA says the ocean is never still, and wave size follows the wind that built it. The power arriving changes with the sea state. | FORCE: the turbines operate across a range of speeds that includes zero. Power varies as the cube of speed, so twice the speed means eight times the power. Slack water is a scheduled dip. | FORCE says tidal lagoons can be configured to generate continuously, which is not the case with barrages. A known tide still leaves hours of little generation on a barrage. |
The wind that raises waves can be tapped before it ever reaches the water. That route is a different comparison, set out in offshore wind versus onshore wind and the offshore wind section.
Takeaway: Name the motion first. A resource figure is only meaningful for the motion the assessment actually measured.
How does each motion become electricity?
A wave converter takes part of the energy the wind has already put into the sea surface. DOE’s basics page points to buoys that move with the water’s vertical and horizontal motion. NOAA’s waves page, updated September 23, 2026, adds the useful limit on that picture: waves transmit energy, not a river of water, across the ocean. How large that energy flux is in deep water, and how the main converter types are grouped, stays on the wave energy explainer. This page does not repeat the formula or the type list.
A tidal stream is moving water, and the machine looks closer to a wind turbine placed in a current. EIA’s tidal page says the water is about 800 times denser than air, so the turbine has to be much sturdier and heavier than a wind turbine of similar blade size. FORCE’s learning page uses the same density contrast, “roughly 800 times,” and adds the speed relation: power output varies as the cube of the speed. EIA also says tidal turbines cost more to build than wind turbines and can capture more energy with the same size blades. That is EIA’s comparison, read on October 11, 2026. It is not a rated output for any machine.
A tidal-range plant uses the head, the vertical difference EIA and FORCE both describe. EIA says producing tidal energy economically requires a tidal range of at least 10 feet. Treat that 10-foot line as EIA’s condition on the page we read, which does not display its own revision date. FORCE separates barrages, which close off an estuary, from lagoons, which are self-contained structures, and says lagoons can be arranged to generate continuously where barrages do not.
Both families of machine sit in seawater. Corrosion and coating systems for steel are a materials question, covered in marine paint for metal and the marine materials section.
Takeaway: Match the machine to the motion, then keep the density and speed relations attached to tidal streams, and the head attached to tidal range.
Is tidal energy more predictable than wave energy?
The clock of the tide is. NOAA’s tides page, updated September 23, 2026, calls tides one of the most reliable phenomena in the world: ocean waters regularly rise and fall along the shore because the moon and the sun pull on the sea. Tides are very long-period waves. High tide is the crest, low tide is the trough, and the tidal range is the height between them.
Surface waves follow a different driver. On the same day’s update, NOAA’s waves page says waves are most commonly caused by wind blowing across the water. A coast can receive large waves from a distant wind, which is why wave power changes with the sea state rather than with the hour of the tide. The Department of Energy, on the marine energy basics page, still describes marine energy resources as a group as highly predictable, and as promising for stable grids. Read that sentence as a statement about the resource class, covering waves and tides together. It does not say wave output is constant, and it does not say a tidal plant runs flat out.
The gap between a reliable schedule and continuous power is the slack. FORCE says in-stream turbines have to operate from zero speed up to a maximum. Because power scales with the cube of speed, the known low point in the cycle is a known low point in output. Barrages, on that same page, are not the case FORCE has in mind when it says a lagoon can be configured for continuous generation. A tide table tells you when the water will be high. It does not tell you that a particular machine is producing in every hour.
Takeaway: Use the tide when you need a regular rise and fall. Expect slack water, or a barrage’s off hours, even though the schedule is reliable. Use the wind-driven sea state when the question is about waves.
What do the terawatt-hour numbers actually measure?
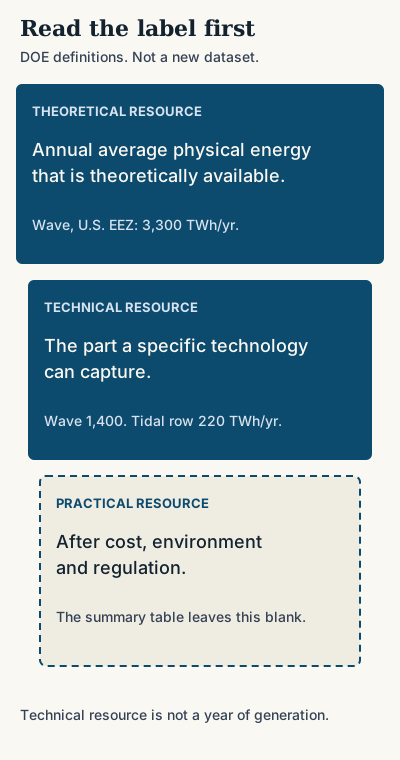
They measure resource potential at a named level, for a named resource, against a named baseline. They do not measure electricity generated in a year. DOE prints three levels above the table:
| Level | DOE’s definition on the resource page | Where it appears in the summary table |
|---|---|---|
| Theoretical | Annual average amount of physical energy that is theoretically available | A column, in TWh/yr |
| Technical | The portion of the theoretical resource that can be captured using a specific technology | A column, in TWh/yr. The column header carries a footnote marker “b”; the footnote text is absent from the page HTML retrieved on October 11, 2026 |
| Practical | The portion of the technical resource available after economic, environmental and regulatory considerations | Defined in the prose. Not given as a column in the summary table |
The page says the table summarizes “Marine Energy in the United States: An Overview of Opportunities,” published in early 2021. The HTML retrieved on October 11, 2026 carries an article modified time of April 23, 2026. The figures below are the ones printed in that table.
| Row | Theoretical | Technical | Technical share of 4,126.7 TWh |
|---|---|---|---|
| Wave, U.S. exclusive economic zone | 3,300 TWh/yr | 1,400 TWh/yr | 34% |
| Wave, out to 10 nautical miles | 1,800 TWh/yr | 770 TWh/yr | 19% |
| Tidal | 440 TWh/yr | 220 TWh/yr | 5.4% |
| All listed marine resources | 5,200 TWh/yr | 2,300 TWh/yr | 57% |
The assessments listed above the table define tidal streams as the energy in the flow of water from tides. The table itself labels the row “Tidal.” It does not add a separate row for tidal-range barrages or lagoons, so 220 TWh/yr should be read as that tidal row’s technical resource, not as a published U.S. tidal-range potential and not as generation. The all-resources technical total, 2,300 TWh/yr, also includes ocean currents, ocean thermal gradients and rivers. Wave and tidal are two rows inside a larger marine total.
The basics page states the same 57% idea in words: the total available U.S. marine energy resource is equivalent to approximately 57% of all U.S. power generation in 2019. The table states the denominator as 4,126.7 TWh and does not repeat the year on the table. Keep the 2019 date attached to the basics page’s sentence.
A second wave figure is easy to set beside these and then misuse. EIA’s wave power page, last updated May 23, 2024, says the theoretical annual energy potential of waves off U.S. coasts was estimated at as much as 2.64 trillion kilowatthours, equal to about 63% of total U.S. utility-scale electricity generation in 2023. Unit for unit, 2.64 trillion kilowatthours is 2,640 terawatt-hours. That is EIA’s theoretical “as much as” figure against a 2023 utility-scale baseline. DOE’s 1,400 TWh/yr is a technical resource for the exclusive economic zone against 4,126.7 TWh. The two numbers describe different resource levels and different baselines. Neither one replaces the other.
The DOE table also converts technical resource into a potential number of homes. This article leaves that column out. The footnote that would explain the conversion is the missing note “b,” so the homes figure would travel without its method.
Takeaway: Quote 1,400 TWh/yr as DOE’s technical wave resource for the U.S. exclusive economic zone, and 220 TWh/yr as the technical figure on the table’s Tidal row. Name the level and the baseline in the same sentence. Leave practical resource blank until a source prints it.
How should a reader use the comparison?
Start from the water in front of you, then pick the row.
If the water of interest is the surface disturbed by wind, the resource is a wave resource. The next page is the wave energy explainer, which holds the deep-water flux relation and the converter groups. If the water is a current that reverses with the tide, the resource is a tidal stream, and the DOE tidal row is the U.S. technical figure in this table. If the opportunity is a basin whose level differs from the open sea, the resource is a tidal range. EIA’s condition for producing tidal energy economically, on the page read October 11, 2026, is a tidal range of at least 10 feet.
If the question is which U.S. resource estimate is larger, stay inside one table. On the DOE table the technical wave resource in the exclusive economic zone is 1,400 TWh/yr and the technical tidal resource is 220 TWh/yr, both as shares of 4,126.7 TWh. That is a difference in estimated technical resource. It is not a build order, a cost comparison or a forecast of generation. Practical resource, the level that folds in cost, environment and regulation, is defined and not filled in.
This page stops before efficiency, environmental effects and project economics. Those questions need their own evidence. Nothing here is investment advice; the About page states what this independent site is and what it is not affiliated with.
Takeaway: Pick the motion, then the matching row, then the resource level printed on that row. Stop when the column you need is the practical one, because this table does not contain it.
When this comparison does not apply
The labels above explain public resource figures. They do not size a site or a machine.
- Device physics in detail. Wave height, period and converter type change the power a wave device can take off. That calculation lives on the wave explainer, and it is a deep-water relation with its own limits.
- A tidal efficiency percentage. Speed, diameter, placement and the cube-of-speed relation all change output. This page does not reduce them to one efficiency. The denominator, the unit, the time scale and the boundary are set out in how efficient is tidal power.
- A project, a permit or a company. EIA’s wave page, updated May 23, 2024, says the United States has no commercially operating wave energy projects. EIA’s tidal page, retrieved October 11, 2026, says the United States does not have any commercially operating tidal power plants, and it does not display a revision date. This article does not extend either sentence into a plant-by-plant census.
- Environmental effects. FORCE notes concerns that come with closing an estuary. Those concerns are outside the mechanism comparison.
- The missing practical column and the missing footnote. Until those are printed, technical resource stays a technology ceiling, not a construction plan.
Takeaway: Use the page to keep the three motions and the resource labels apart. Take a site, a yield or a permit question to the primary documents.
Methods and sources
Compiled on October 11, 2026 from the public pages listed in the references. The DOE resource numbers come from the table on the resource-assessment page, which says it summarizes the early-2021 overview. The retrieved HTML records an article modified time of April 23, 2026. NOAA’s tide and wave fact pages both say they were last updated on September 23, 2026. EIA’s wave page says it was last updated on May 23, 2024. EIA’s tidal page, retrieved the same day as this article, does not display a revision date; claims about individual operating plants on that page are left out. FORCE’s learning page supplies the split between height and flow, the cube-of-speed relation, and the point that the speed range includes zero. Paragraphs there about the operating status of historical stations are not used. The 2,640 terawatt-hour figure is a unit conversion of EIA’s stated 2.64 trillion kilowatthours, not a separate estimate.
The diagrams are schematics drawn for this article. No device was tested for this page, and no new resource dataset was calculated. Full links are in the references below.