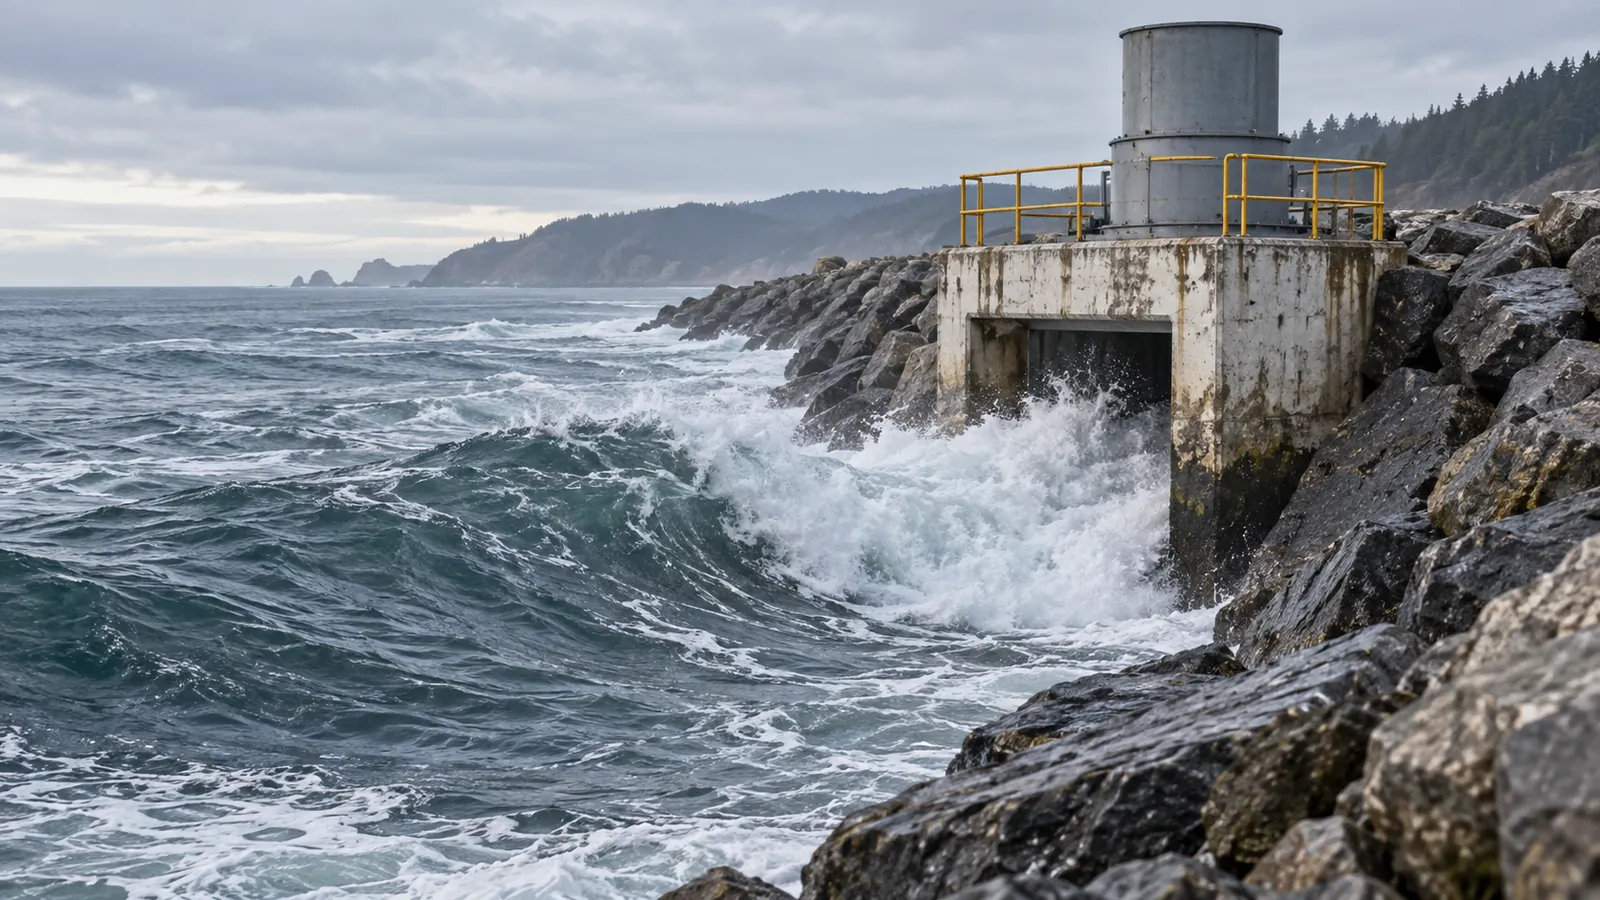
Judge a wave site by wave height alone and you can get its energy wrong several times over, which leads straight to the wrong site or the wrong device size, because in deep water the power waves carry grows with the square of their significant height and in step with their period. Wave energy is the energy that wind puts into the sea surface; a wave energy converter takes part of it by letting waves move a float, a flap, a column of air or a reservoir of water, and turns that motion into electricity.
In deep water, the power carried by waves is about 0.49 × (significant wave height)² × (energy period) kilowatts for every metre of wave front, a standard relation from the wave-resource literature. That figure is the power arriving, not what any machine delivers. Across U.S. waters, the Department of Energy’s 2021 resource overview puts the technical wave resource at 1,400 terawatt-hours a year, equal to 34% of the annual U.S. generation figure the overview uses as its baseline, yet the EIA’s wave power page, last updated in May 2024, reported no commercially operating wave energy project in the country.
This explainer is compiled from public government, standards and peer-reviewed sources. It is not based on our own measurements, and it does not assess any project or company. It opens our wave energy section.
Key points
- Wind makes waves. How big they get depends on wind strength, how long it blows and the distance of open water it blows across.
- In deep water, wave power per metre of crest scales with significant wave height squared times energy period: double the height at the same period and the power roughly quadruples.
- The European Marine Energy Centre (EMEC) groups converters into eight working principles, from point absorbers to oscillating water columns.
- Seawater is the hard part: corrosion and marine growth drive maintenance, which is where coating systems that protect steel at sea come in.
What is wave energy?
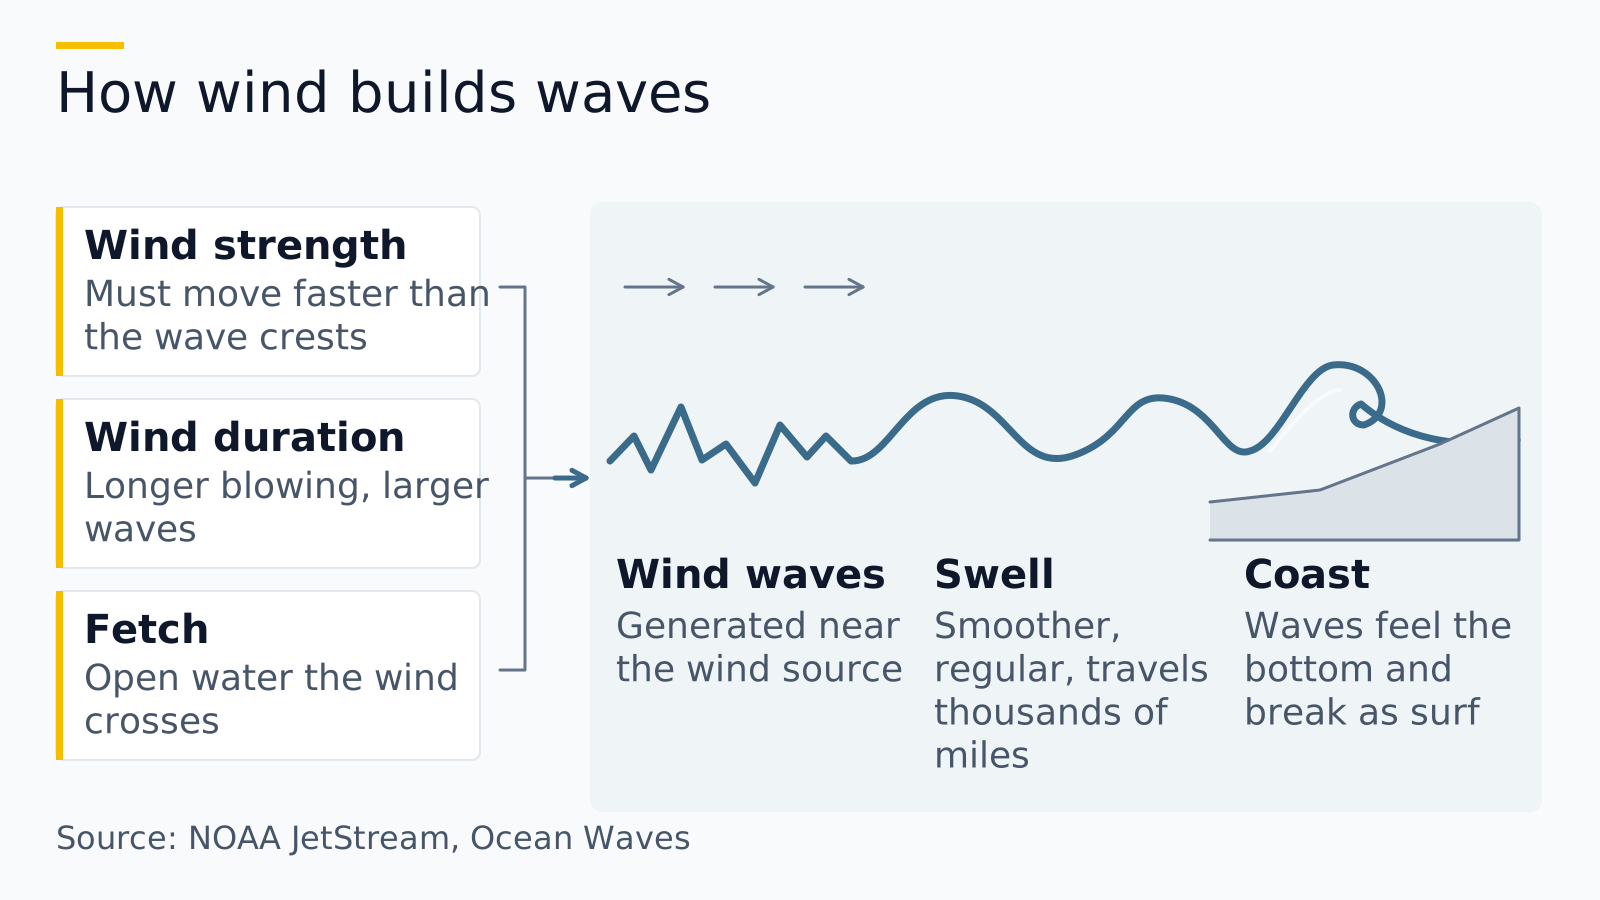
Wave energy is the kinetic and potential energy carried by waves on the sea surface, and almost all of it comes from wind. NOAA’s National Ocean Service explains that friction between wind and water disturbs the surface and builds a crest; as the surface roughens, the wind gets more grip and the waves grow.
How big wind waves get depends on three things, according to NOAA’s JetStream guide:
| Factor | What it means | Effect on waves |
|---|---|---|
| Wind strength | The wind must move faster than the wave crests to pass energy to them | Stronger wind builds bigger waves |
| Wind duration | How long a strong wind keeps blowing | Longer blowing builds larger waves |
| Fetch | The uninterrupted distance the wind blows over water without much change in direction | Equal storms raise much larger waves over the long open Pacific than over smaller basins |
Once waves outrun the storm that made them, they become swell. JetStream describes swell as smoother, more regular waves that can travel thousands of miles with little change in height and period, with longer waves travelling faster. That is why an exposed coast can receive energetic waves on a calm local day: the energy was put into the sea by a storm far away. Offshore wind turbines tap the same wind directly, before it reaches the water; our offshore vs onshore wind comparison and the wider offshore wind section cover that route.
Takeaway: Wave energy is stored wind energy, delivered by swell from distant storms as well as by local wind.
How much power is in a wave?
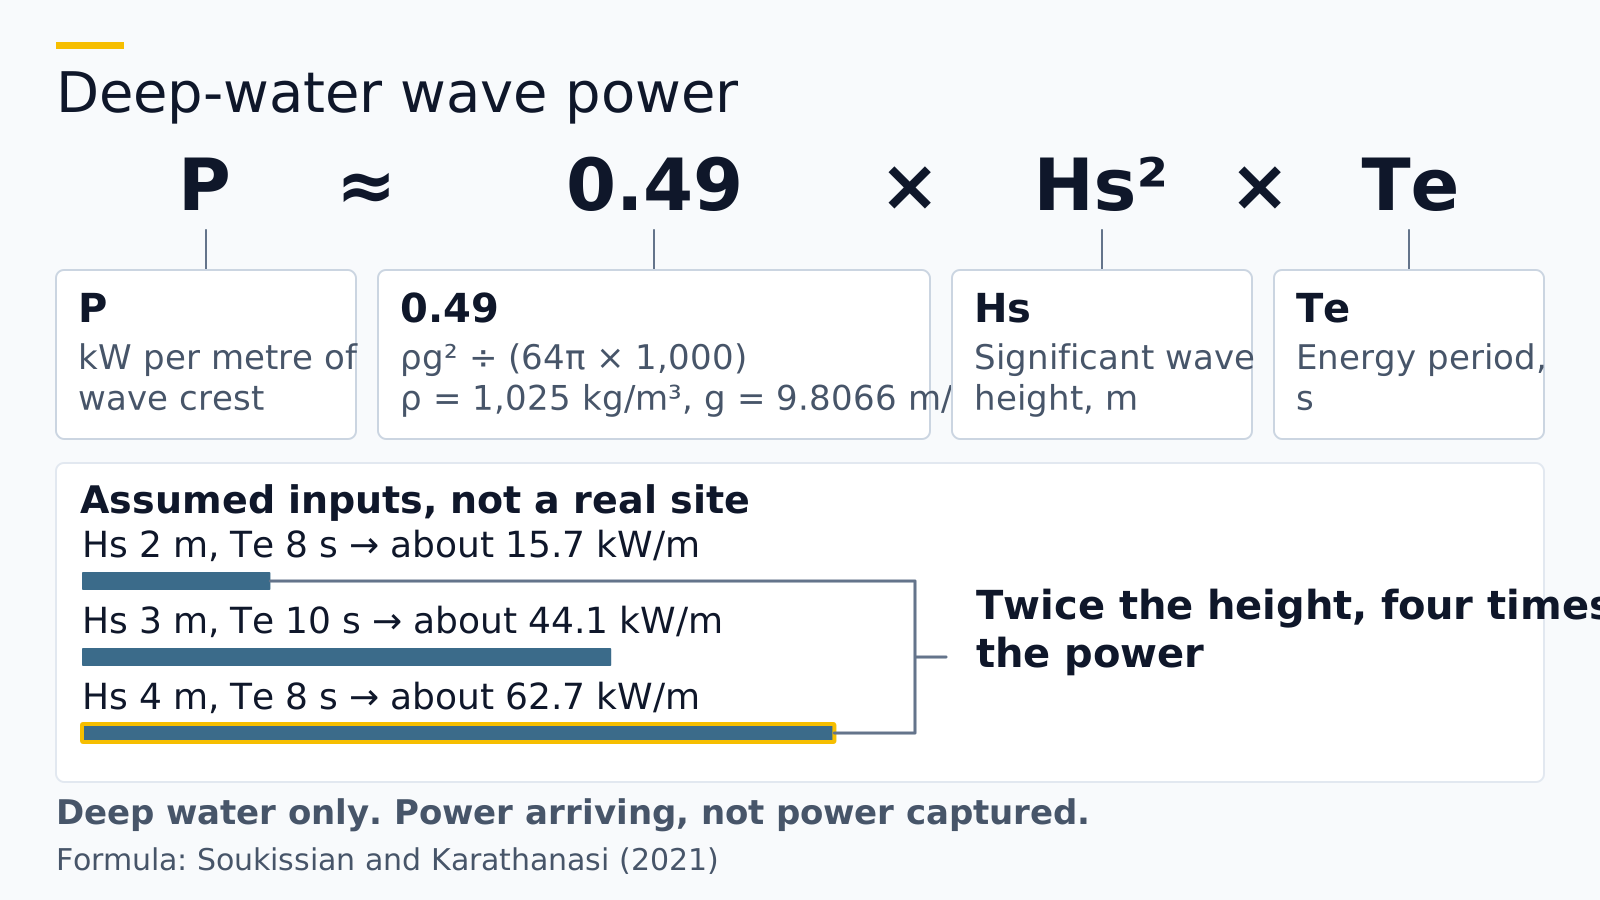
In deep water, the power that waves carry toward the shore is roughly 0.49 × Hs² × Te kilowatts per metre of wave front, where Hs is the significant wave height in metres and Te is the energy period in seconds. The relation is written out in a 2021 paper by Soukissian and Karathanasi, who take seawater density as 1,025 kg/m³ and gravity as 9.8066 m/s².
| Symbol | Name | Unit | Where you get it |
|---|---|---|---|
| P | Wave energy flux (wave power) | kW per metre of wave crest | The result |
| ρ | Seawater density | kg/m³ | 1,025 in the published coefficient |
| g | Gravitational acceleration | m/s² | 9.8066 in the published coefficient |
| Hs | Significant wave height | m | Buoys and wave models; NOAA’s buoy centre defines it as the average of the highest one-third of waves in a 20-minute record |
| Te | Energy period | s | Calculated from the wave spectrum; not the same as the dominant or average period a buoy feed lists |
| 0.49 | ρg² ÷ (64π × 1,000), rounded | kW/(m³·s) | Combines the constants above; the 1,000 turns watts into kilowatts |
Three worked examples show how fast the number moves. These use assumed inputs and describe no real site.
| Example (assumed inputs) | Hs | Te | Calculation | Wave power |
|---|---|---|---|---|
| Moderate swell | 2 m | 8 s | 0.49 × 2² × 8 | about 15.7 kW per metre |
| Larger swell | 3 m | 10 s | 0.49 × 3² × 10 | about 44.1 kW per metre |
| Same period, twice the height of the first | 4 m | 8 s | 0.49 × 4² × 8 | about 62.7 kW per metre, four times the first |
The short formula is a deep-water simplification. The general form in the same paper adds up power across the whole wave spectrum using the group velocity, which depends on water depth, so the simple version stops holding as waves reach shallower water. For formal resource studies, the international technical specification IEC TS 62600-101:2024 sets out how to estimate, analyse and report the wave resource at a site.
Common mistake: Plugging a buoy’s “dominant wave period” straight into the formula. NOAA’s buoy feeds list a dominant period (the period with the most energy) and an average period; the energy period is a different statistic calculated from the spectrum, so neither can stand in for it. Calculate Te from the spectral file instead, as shown in the next section.
Takeaway: Use 0.49 × Hs² × Te for a deep-water order of magnitude, and remember it measures the power passing by, not the power a device can capture.
How can you estimate wave power from buoy data?
You can work out an hourly deep-water estimate yourself from a NOAA National Data Buoy Center (NDBC) station’s spectral wave file, which lists wave energy density in square metres per hertz for frequency bins typically running from 0.03 to 0.40 Hz. The five steps below turn that file into Hs, Te and wave power using the definitions in the 2021 Soukissian and Karathanasi paper.
| Step | What you do | Formula | Unit |
|---|---|---|---|
| 1. Get the spectrum | Download one hour of spectral wave density for a deep-water buoy | S(f) for each frequency f | m²/Hz |
| 2. Add up the spectrum | Multiply each bin’s density by its bin width (the gap to the neighbouring frequency) and sum | m₀ = Σ S(f)·Δf | m² |
| 3. Add up the spectrum divided by frequency | Same, but divide each density by its frequency first | m₋₁ = Σ S(f)·Δf ÷ f | m²·s |
| 4. Get the two inputs | Significant wave height and energy period | Hs ≈ 4√m₀; Te = m₋₁ ÷ m₀ | m; s |
| 5. Apply the shortcut | Deep water only | P ≈ 0.49 × Hs² × Te | kW per metre |
Two checks keep the result honest. Compare your Hs with the significant wave height (WVHT) the same buoy reports for that hour; a large gap usually points to a unit or bin-width slip in your sums. And treat one hour as a snapshot: a resource assessment under IEC TS 62600-101 characterises how the resource varies over time and across a site, which takes years of records rather than one reading.
Takeaway: Five sums on a buoy’s spectral file give you a defensible deep-water estimate for one hour; a site judgement needs the long record.
How does a wave become electricity?
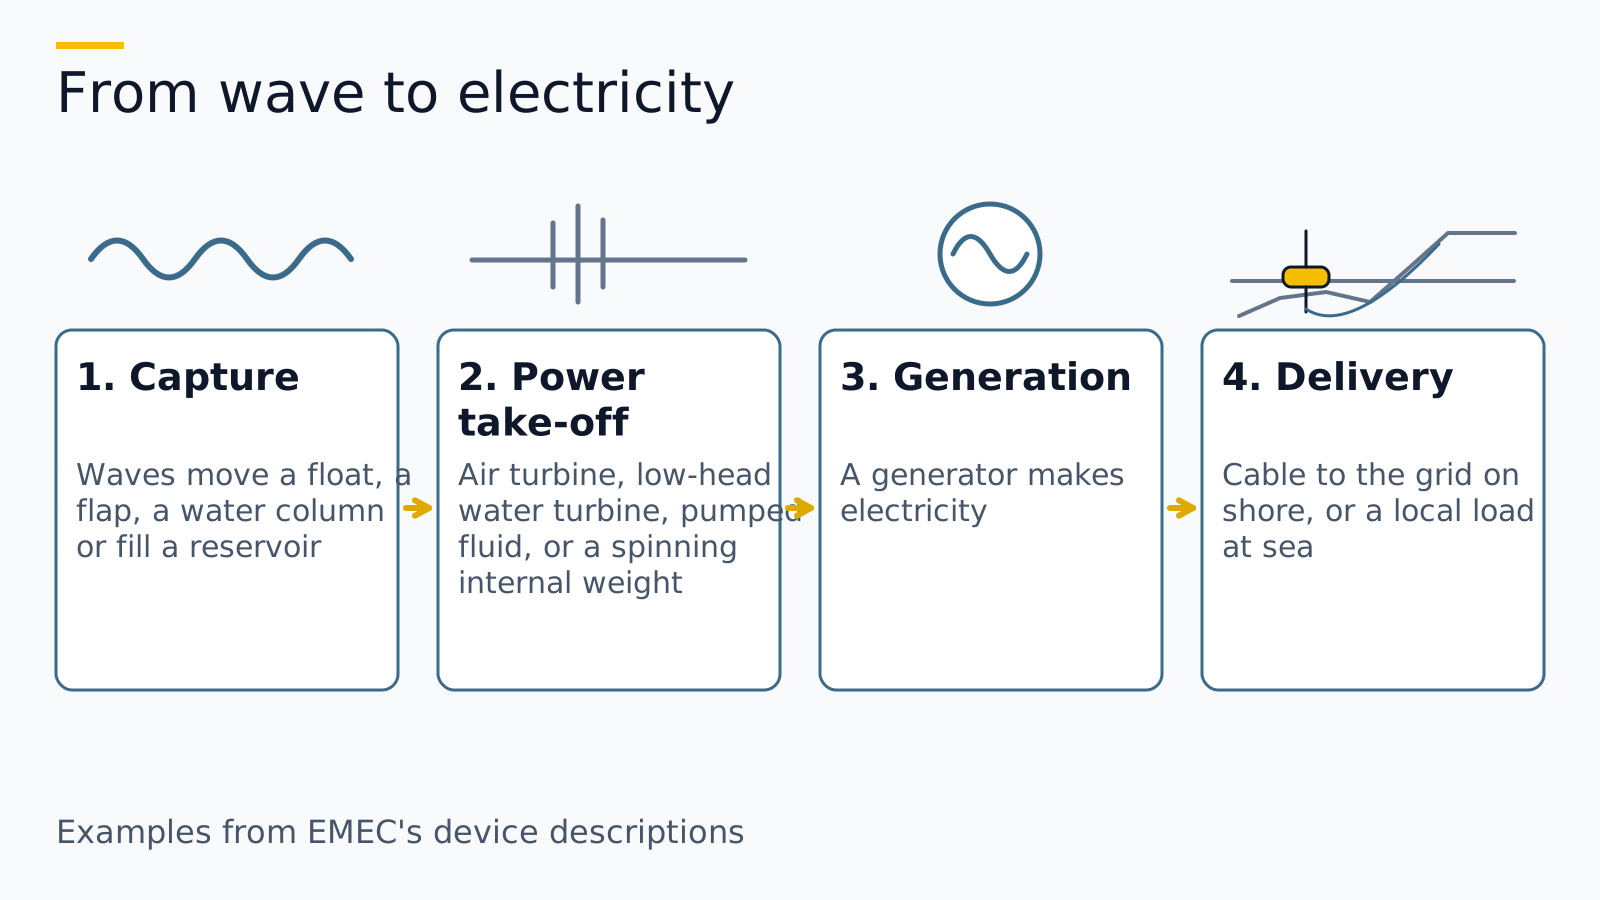
A wave energy converter turns motion into electricity in four stages: something in the device is moved by the waves, a power take-off turns that motion into rotation or fluid flow, a generator makes electricity, and a cable or local connection delivers it. Each converter type described by EMEC solves the first two stages differently.
| Stage | What happens | Examples from EMEC’s device descriptions |
|---|---|---|
| 1. Capture | Waves move part of the device relative to another part or to the seabed | A float riding up and down; a hinged flap swinging; water rising in a chamber |
| 2. Power take-off | That motion is turned into something a generator can use | Air pushed through a turbine; water released through a low-head turbine; fluid pumped round a circuit; an internal weight or gyroscope set spinning |
| 3. Generation | A generator converts the motion into electricity | Generators driven by air or water turbines, or attached to the moving weight inside a rotating-mass device |
| 4. Delivery | Power goes to a user | A grid connection on shore, or a local load at sea such as ocean-observing equipment |
The capture stage has to cope with motion that reverses every few seconds and changes in size from one wave to the next. EMEC’s description of the oscillating water column shows one answer: the air turbine usually keeps turning in the same direction whichever way the air flows, so the air going in and the air going out both do work.
Takeaway: When you read about a device, ask what moves, what the power take-off is, and where the electricity goes; those three answers place it among the types below.
What types of wave energy converters are there?
EMEC groups wave energy converters into eight working principles, plus an “other” group for designs that fit none of them. The table puts them side by side on the same three questions.
| Type (EMEC) | What moves | How power is taken off | Position, as EMEC describes it |
|---|---|---|---|
| Attenuator | Arms of a long floating device, moving relative to each other as the wave passes | Relative motion of the arms | Floating, parallel to the wave direction |
| Point absorber | A buoyant top moving relative to its base | Several possible forms, depending on the design | At or near the surface, taking energy from all directions |
| Oscillating wave surge converter | An arm swinging like a pendulum on a pivoted joint | The pivoting motion, driven by the surge of water in the waves | Not specified by EMEC |
| Oscillating water column | A column of water inside a hollow structure, pushing a column of air | Air flows through a turbine to and from the atmosphere | Partly submerged, open to the sea below the waterline |
| Overtopping / terminator | Water that spills over into a storage reservoir | Water returns to the sea through a low-head turbine | Not specified by EMEC |
| Submerged pressure differential | The sea level above the device, rising and falling | The changing pressure pumps fluid through a system | Typically near shore, attached to the seabed |
| Bulge wave | A pressure bulge travelling along a water-filled rubber tube | A low-head turbine at the bow | Moored to the seabed, heading into the waves |
| Rotating mass | The whole device heaving and swaying | An eccentric weight or gyroscope drives a generator inside | Not specified by EMEC |
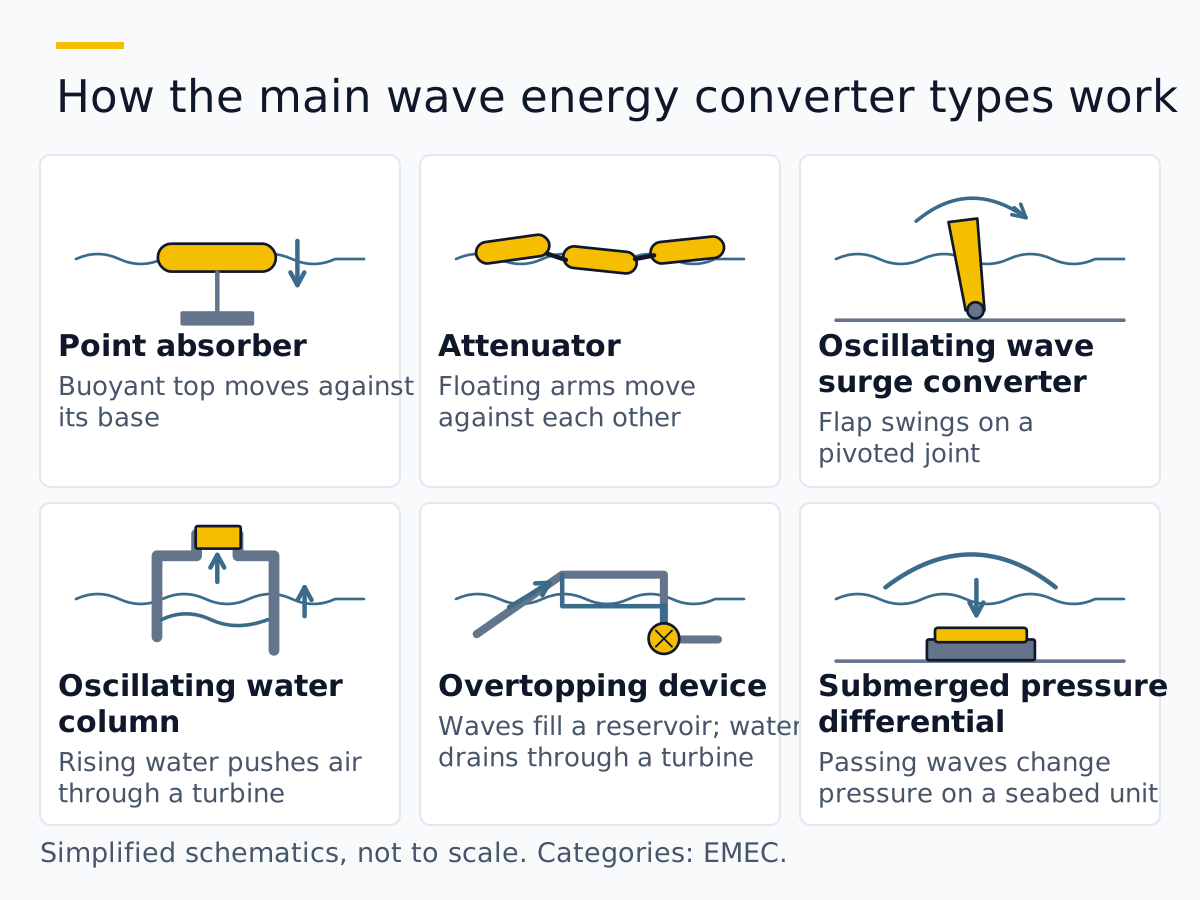
Common mistake: Calling every floating device a “wave buoy.” A float can be a point absorber, part of an attenuator or a rotating-mass device, and each takes power off in a different way. Look for the working principle, not the shape.
Takeaway: The type tells you what moves and how power is extracted, which in turn tells you what has to survive the sea.
How much wave energy does the United States have?
The Department of Energy’s 2021 summary, “Marine Energy in the United States: An Overview of Opportunities,” estimates a technical wave resource of 1,400 terawatt-hours a year across the U.S. exclusive economic zone, equal to 34% of the 4,126.7 terawatt-hours of annual U.S. electricity generation that the DOE table uses as its baseline (the web table does not state the baseline year). Within 10 nautical miles of shore the technical figure is 770 terawatt-hours a year, or 19%.
These are different kinds of number, and the definitions matter:
| Resource level (DOE definitions) | Meaning | Wave, U.S. EEZ | Wave, to 10 nautical miles |
|---|---|---|---|
| Theoretical | Annual average physical energy theoretically available | 3,300 TWh/yr | 1,800 TWh/yr |
| Technical | The part of the theoretical resource that a specific technology could capture | 1,400 TWh/yr | 770 TWh/yr |
| Practical | What is left after economic, environmental and regulatory considerations | Not given in the summary table | Not given in the summary table |
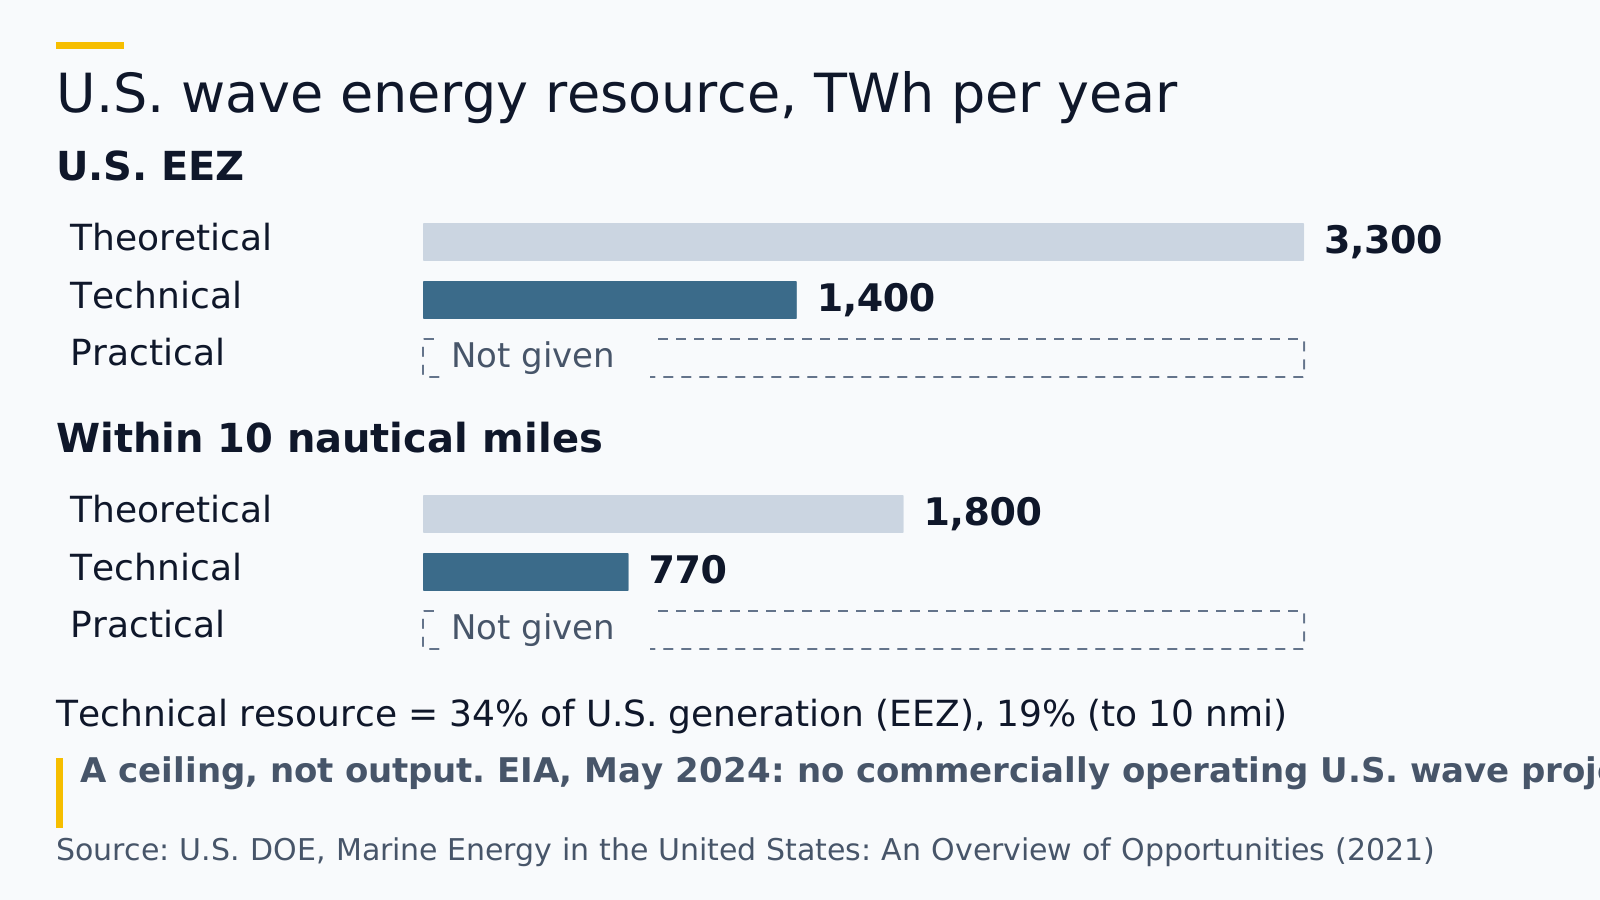
For all marine energy sources together (waves, tides, ocean currents, ocean thermal gradients and rivers), the same table gives a technical resource of 2,300 terawatt-hours a year, or 57% of generation. Waves are the largest single part.
None of these figures is a forecast. The EIA’s wave power page, last updated May 23, 2024, says the United States has no commercially operating wave energy projects, with several research projects under way or planned. The distance between a large technical resource and that operating record sits in the layer DOE’s table leaves blank: the economic, environmental and regulatory considerations that turn a technical resource into a practical one.
Takeaway: Quote the technical resource as a ceiling for what technology could capture, never as what is being or will be generated.
Why is seawater hard on wave energy devices?
Because the same sea that delivers the energy also attacks the machine. The Department of Energy describes corrosion and biofouling (the build-up of plants, algae and other organisms on surfaces) as problems that increase maintenance, reduce performance and can shorten the life of marine energy equipment.
Developers take two broad routes against corrosion, each with a cost, according to a March 2024 DOE article on a Pacific Northwest National Laboratory project:
| Route | Benefit | Trade-off DOE describes |
|---|---|---|
| Build in duplex or super duplex stainless steel | Higher corrosion resistance | More expensive material, raising the device’s total cost |
| Use cheaper materials with anticorrosion paint | Lower material cost | Paint may need reapplying several times, with the device taken out of operation for repainting |
Marine growth is handled separately. The same article notes that antifouling paints and coatings are typically copper-based, and that marine wildlife may be harmed as they dissolve into the surrounding water.
For how coating systems are built up, and why the splash zone is treated differently from fully submerged steel, read our guide to marine paint and coating systems for steel; the marine materials section collects related explainers.
Takeaway: Corrosion protection is part of a wave device’s energy cost, because a repaint that takes the device out of operation is time it is not generating.
What are the advantages and limits of wave energy?
Wave energy has a large documented resource and suits remote and maritime uses, but as of the EIA’s May 2024 update no commercial wave project was operating in the United States, and its machines must survive a harsh environment. The table sets out each point with its source.
| Point | What the source says | What it means for a reader |
|---|---|---|
| Large resource | DOE 2021: 1,400 TWh/yr technical resource in the U.S. EEZ | Worth studying, but it is a ceiling, not an output |
| Swell carries energy from far away | NOAA JetStream: swell travels thousands of miles with little change in height and period | A coast can receive wave energy without local wind |
| Fits remote and maritime uses | DOE: remote and island communities, ocean-observing technology, desalination devices | Early uses may be off-grid rather than utility power |
| Not yet commercial in the U.S. | EIA, May 2024: no commercially operating wave projects | Treat performance and cost claims as developer claims until proven in service |
| Harsh environment | DOE, 2024: corrosion and biofouling raise maintenance and can shorten equipment life | Materials and maintenance shape what a device can deliver |
| Environmental effects still studied | OES-Environmental 2024 report, from 16 participating countries: covers collision risk, electromagnetic fields, underwater noise, habitat change, entanglement and displacement | Expect site-specific environmental review |
Offshore wind meets the same environment at far larger scale: NREL’s modelled operating cost for a fixed-bottom offshore plant is about three times that of a land-based plant, as our maintenance comparison for offshore wind sets out.
Takeaway: Read wave energy claims against this table: resource size is well documented, while commercial performance in U.S. waters is not yet.
When this does not apply
The formula, the resource figures and the device descriptions on this page explain the physics; they do not size a project, judge a site or predict output. These are the main limits.
- Shallow water and breaking waves. The 0.49 × Hs² × Te shortcut is a deep-water relation. Nearer shore, depth changes the group velocity and the result; use a spectral method such as the one in IEC TS 62600-101.
- Device output. The formula gives power arriving per metre of wave front. What a converter delivers depends on its design, size, tuning and losses, which public resource figures do not tell you.
- Specific sites and projects. Nothing here assesses a site, a project, a permit or a company. Check the regulator and the developer’s own filings for any project question.
- Extreme waves. Resource assessment methods such as IEC TS 62600-101 are not meant for estimating extreme wave conditions, which matter for survival design.
- Investment decisions. Resource estimates are not market forecasts, and this page is not financial advice; the About page sets out what this independent site is and is not.
Takeaway: Use this page to understand the physics and the vocabulary; take site, device and money questions to primary project documents.
Methods and sources
This page was compiled on October 7, 2026 from public sources: U.S. Department of Energy pages (resource overview table, Marine Energy Program, a March 2024 project article), the U.S. Energy Information Administration’s wave power page (last updated May 23, 2024), NOAA JetStream and the NOAA National Ocean Service, the NOAA National Data Buoy Center’s measurement definitions, a 2021 peer-reviewed paper for the deep-water power relation, the IEC catalogue entry for IEC TS 62600-101:2024, EMEC’s device classification and the OES-Environmental 2024 report page. The worked examples are our own arithmetic on assumed inputs. We did not test any device. Full links are listed under the references below. Who runs this site, and what it is not affiliated with, is set out on the About page; every explainer is listed on the articles page.
Takeaway: Every number on this page traces to a dated public source listed below; check the newer edition of each source before reusing a figure.
Related reading
- More wave energy explainers — Every article in this section, newest first.
- Offshore vs onshore wind — The other main ocean energy technology, compared on cost, output and siting.
- Marine paint for metal — How coating systems keep steel working in seawater.