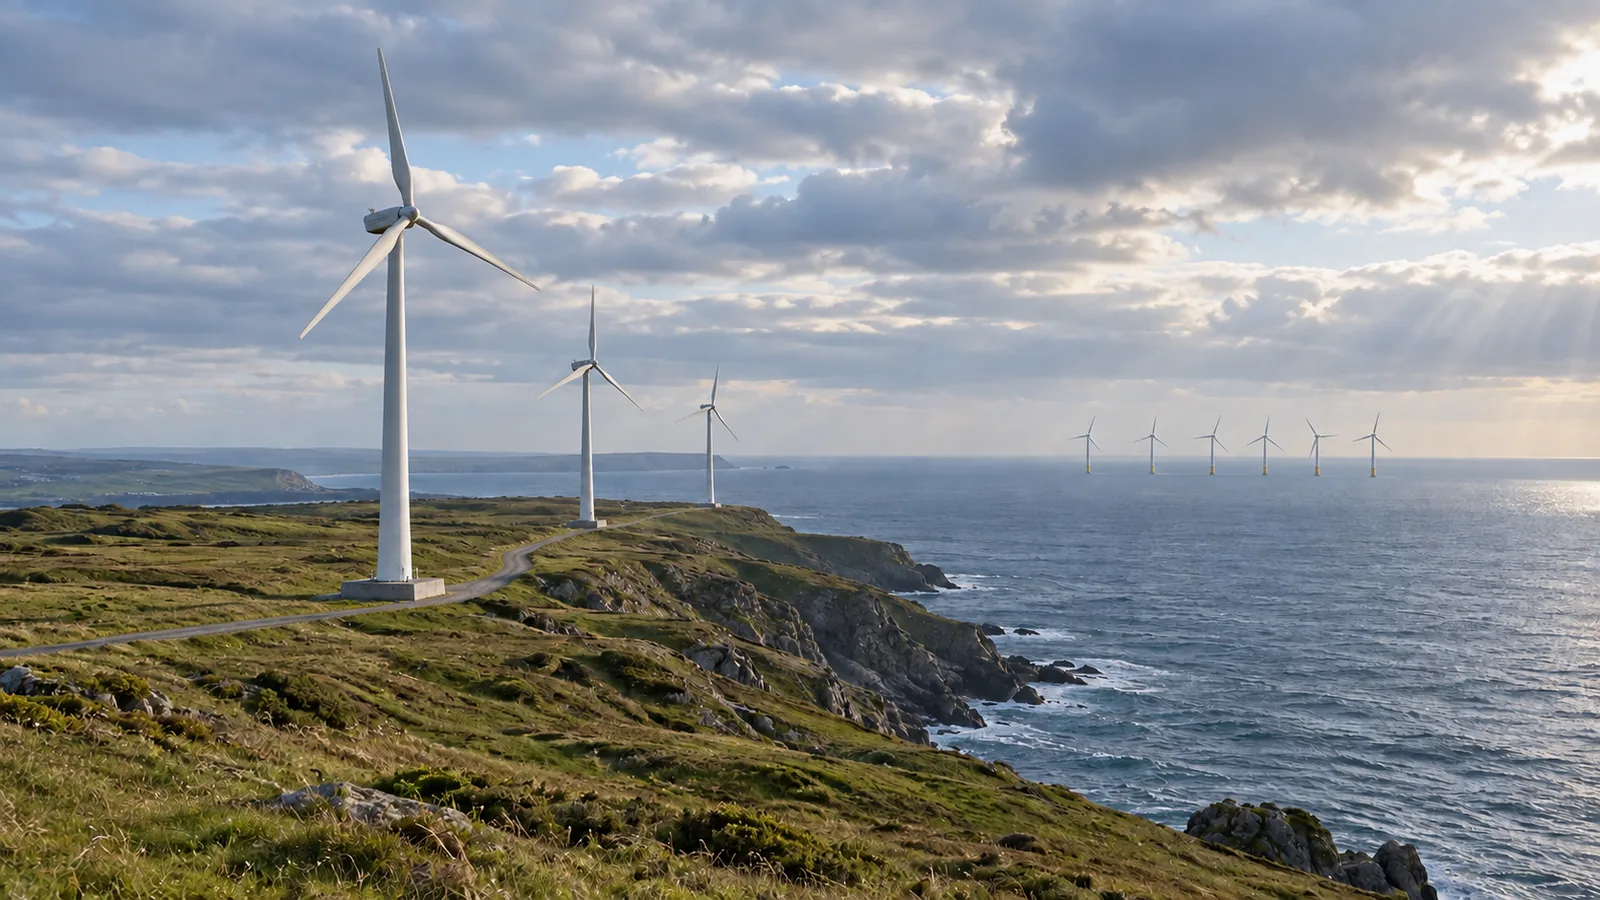
Compare offshore and onshore wind on building cost alone and offshore looks almost three times worse per kilowatt, which hides why coastal states pursue it at all. Onshore wind is the mature, cheaper source that already supplies about a tenth of U.S. electricity; offshore wind costs more to build and run, but it reaches stronger, steadier winds near coastal cities that have little room for land-based turbines.
In a 2024 Department of Energy laboratory review that models both on the same basis, a representative land-based U.S. wind plant costs $42 per megawatt-hour and a fixed-bottom offshore plant $117, in 2023 dollars, while the offshore plant’s net capacity factor is slightly higher (49.0% against 46.9%). Those are modelled reference plants, not real projects, and the U.S. offshore fleet is still tiny: 174 MW were operating on May 31, 2024, against about 150 GW of land-based wind at the end of 2023.
This comparison is compiled from public government and laboratory sources. It is not based on our own testing and does not assess any project, company or lease. It belongs to our offshore wind section.
Quick specs: the numbers that decide the comparison
| Input or item | Typical value or source | Why it matters |
|---|---|---|
| Turbine size | Land-based: 3.4 MW average new U.S. turbine in 2023 (LBNL); offshore reference: 12 MW (NREL) | Bigger offshore machines spread fixed costs over more output |
| Net capacity factor | Reference plants: 46.9% land, 49.0% fixed-bottom, 38.2% floating (NREL, modelled) | Share of rated output actually produced over a year |
| Real fleet capacity factor | U.S. land-based fleet: 33.5% in 2023, a low-wind year (LBNL) | Shows how far real plants sit from modelled ones |
| Capital cost | $1,968/kW land, about $5,400/kW fixed-bottom, $7,349/kW floating (NREL, 2023 $) | The biggest driver of cost per MWh |
| Operating cost | $43, $135 and $108 per kW per year (NREL, 2023 $) | Vessels, access and repairs at sea cost more |
| Cost per MWh (LCOE) | $42 land, $117 fixed-bottom, $181 floating (NREL, 2023 $) | The common yardstick, but not a contract price |
| U.S. installed scale | About 150 GW land (end 2023, LBNL); 174 MW offshore (May 31, 2024, NREL) | Offshore figures rest on very few U.S. plants |
| Where federal rules start | Usually 3 nautical miles from shore; 9 off Texas, Florida’s Gulf Coast and Puerto Rico (BOEM) | Beyond that line, BOEM leases offshore wind |
What is the difference between offshore and onshore wind?
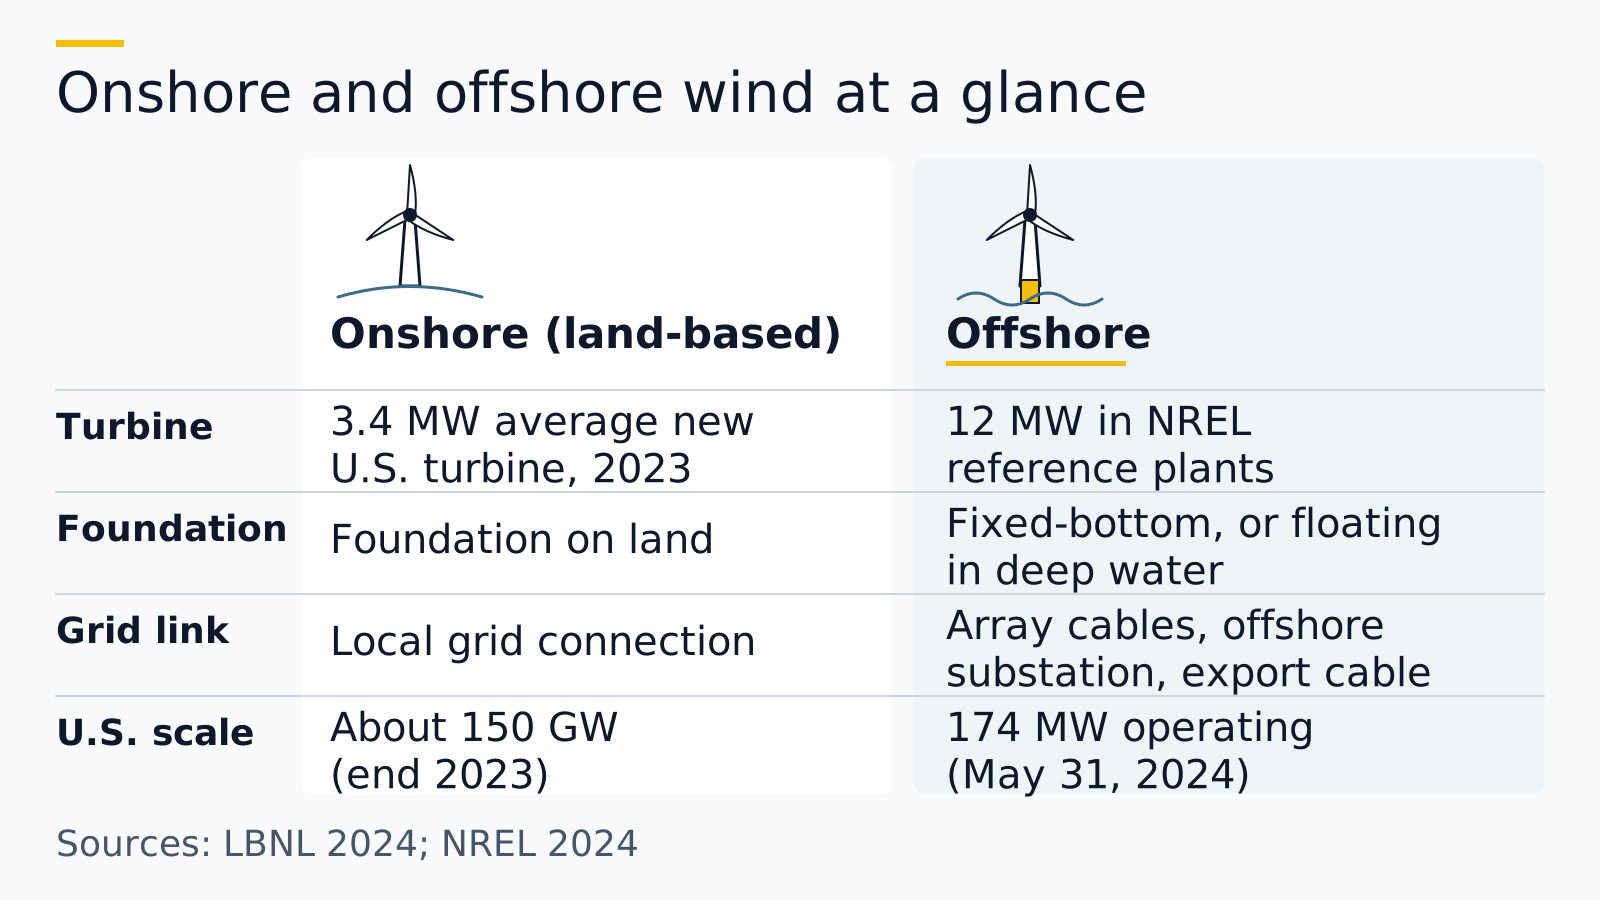
Offshore wind farms stand in the sea on fixed or floating foundations; onshore (land-based) wind farms stand on land. Both use the same basic turbine, which BOEM describes as airfoil-shaped blades turning a shaft that drives a generator. What changes is the size of the machines, the foundation, how power reaches shore, who regulates the site and what it costs to build and maintain. Scale differs too: the 174 MW of U.S. offshore wind operating in May 2024 was about 0.1% of the roughly 150 GW of land-based wind installed by the end of 2023.
| Feature | Onshore (land-based) | Offshore |
|---|---|---|
| Foundation | Foundation on land | Fixed-bottom foundations in shallower water; floating platforms in deep water |
| Typical new U.S. turbine | 3.4 MW, 103.4 m hub height, 133.8 m rotor (2023 average, LBNL) | 12 MW in NREL’s reference plants |
| Power to the grid | Local grid connection | Array cables, an offshore substation and an export cable to shore (NREL cost breakdown) |
| U.S. scale | About 150 GW (end 2023) | 174 MW in operation (May 31, 2024) |
| Federal regulator for siting at sea | Not applicable | BOEM, in federal waters |
| Main U.S. regions | Central states, where capacity factors are highest (LBNL) | Coastal waters; the EIA describes projects off the East Coast in various stages of planning and development |
Takeaway: Offshore and onshore wind are the same technology in very different settings; nearly every difference that matters follows from the sea.
Which one gets more energy from the wind?
In NREL’s modelled reference cases, the fixed-bottom offshore plant produces slightly more electricity per megawatt of capacity than the land-based plant, while the floating plant produces less. BOEM notes that offshore winds tend to blow harder and more uniformly than on land, and the fixed-bottom reference site in the North Atlantic has an average hub-height wind speed of 9.05 m/s, against 8.01 m/s at the land-based site. Each offshore turbine also produces far more in total, mainly because it is rated at 12 MW against 3.3 MW.
| Measure | Land-based | Fixed-bottom offshore | Floating offshore |
|---|---|---|---|
| Hub-height wind speed, reference site | 8.01 m/s | 9.05 m/s | 8.24 m/s |
| Net capacity factor, reference plant (modelled) | 46.9% | 49.0% | 38.2% |
| Net energy per MW per year (modelled) | 4,104 MWh | 4,295 MWh | 3,346 MWh |
| Observed U.S. fleet average | 33.5% in 2023; 38.2% for plants built in 2022 (LBNL) | Not given in the sources used here | Not given in the sources used here |
The capacity factor is the electricity a plant produces in a year divided by what it would produce running at full rated output all year. A higher figure means each megawatt of capacity delivers more electricity over the year; it is not the same as how efficiently a turbine converts the wind’s energy. Land-based capacity factors also vary by region: LBNL found them highest in the central states and lower closer to the coasts, roughly in line with wind resource quality.
Common mistake: Comparing a modelled offshore capacity factor with the real land-based fleet. NREL’s 46.9% land-based reference plant is a new, tall turbine at a good site; the 33.5% fleet figure includes older plants and a low-wind year. Compare modelled with modelled, or fleet with fleet.
Takeaway: In NREL’s reference cases, fixed-bottom offshore wind delivers only slightly more per megawatt than a modern land-based plant and floating wind delivers less; the big offshore gain is per turbine, from larger machines.
Why does offshore wind cost more?
Offshore wind costs more mainly because building and servicing at sea is expensive. In NREL’s 2024 review, a fixed-bottom offshore plant needs roughly 2.7 times the capital per kilowatt of a land-based plant and about three times the operating cost, and its slightly higher output does not close that gap: its modelled cost per MWh is about 2.8 times the land-based figure, and the floating plant’s about 4.3 times.
| Cost item (2023 USD) | Land-based | Fixed-bottom offshore | Floating offshore |
|---|---|---|---|
| Capital expenditure | $1,968/kW | About $5,400/kW | $7,349/kW |
| Operating expenditure | $43/kW per year | $135/kW per year | $108/kW per year |
| Levelized cost of energy | $42/MWh | $117/MWh | $181/MWh |
| Single-variable sensitivity range | $30–61/MWh | $76–234/MWh across both offshore types | Same range |
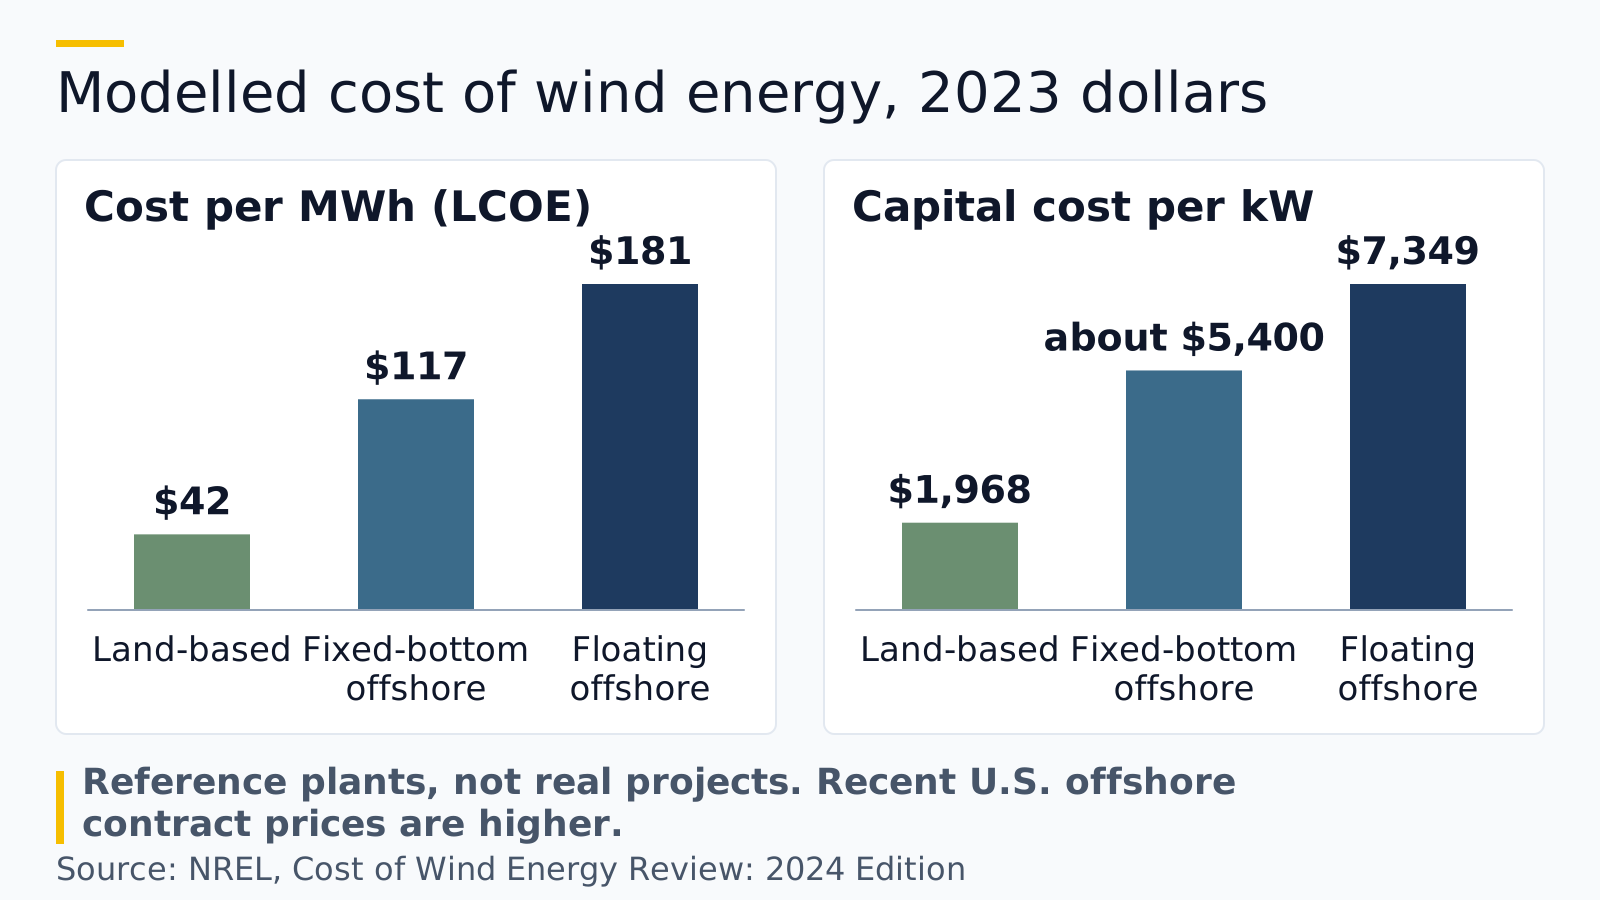
Where does the extra capital go? NREL’s breakdown for the fixed-bottom plant lists items a land plant does not need or needs far less of: substructures and transition pieces, scour protection, an offshore substation, array and export cables, and installation at sea. The floating plant’s lower operating cost reflects NREL’s assumption that big repairs are done by towing the unit back to port rather than in place at sea.
Two cautions keep these numbers honest. First, they are modelled reference plants: a 200 MW land-based plant of 61 turbines and 600 MW offshore plants of 50 turbines, with operation assumed to start in 2023 and, offshore, mature supply chains. Second, NREL itself warns that recent U.S. offshore wind contract (strike) prices are higher than its LCOE estimates. It gives two reasons: LCOE and strike price are different things, so developer profit and differences in technology, infrastructure, project structure, cost, performance, subsidy and financing terms have to be accounted for; and recent solicitations are for projects due between 2026 and the early 2030s, with different exposure to risk and inflation.
Common mistake: Treating LCOE as the price consumers pay. LCOE is a cost yardstick for a modelled plant, not a contract price or a retail electricity rate, and NREL cautions against comparing it directly with contract prices.
Takeaway: On NREL’s modelled numbers, fixed-bottom offshore wind costs about 2.8 times as much per MWh as land-based wind and floating wind about 4.3 times; the case for offshore wind has to rest on location, scale or policy goals rather than cost alone.
How hard is it to operate and maintain wind turbines at sea?
Much harder, because crews and parts travel by sea and the structure sits in corrosive seawater. NREL’s operating-cost model for its offshore reference plants assumes 30 full-time technicians, three crew transfer vessels, a cable-laying vessel and a diving support vessel per project; transition pieces carry personnel access systems such as boat landings and platforms so crews can step on and off.
| Maintenance factor | Onshore | Offshore |
|---|---|---|
| Access | By road | By vessel in NREL’s model; NREL’s 2024 market report notes higher operations and maintenance costs with distance from shore and harsher meteorological conditions |
| Major repairs | Cranes on land | Repairs in place (fixed-bottom) or tow to port (floating), in NREL’s model |
| Corrosion exposure | Weather | Salt spray, splash and immersion; DNV’s recommended practice DNV-RP-0416 addresses corrosion protection with emphasis on offshore support structures |
| Structural loads | Wind | Wind plus wave loading and seabed conditions, which BOEM says drive offshore design |
| Ageing | LBNL: median land-based capacity factor at year 20 is roughly 70% of year 2 | No long U.S. record yet |
Corrosion protection is a design subject in its own right offshore: support structures pass through the atmosphere, the splash zone and full immersion, and each zone is protected differently. Our guide to marine paint and coating systems for steel explains how those coating systems are built up, and the marine materials section collects related explainers.
Takeaway: Offshore operating cost is driven by access and the marine environment, so maintenance strategy matters as much as turbine choice.
Where can each one be built?
Land-based wind goes where the wind is good and land is available; offshore wind goes where the water is shallow enough, or the platform can float, within reach of a grid connection. The EIA puts good utility-scale land sites at an annual average wind speed of at least 13 mph (5.8 m/s), on smooth hilltops, open plains and water, and mountain gaps.
At sea, two limits shape siting: distance and depth.
| Siting factor | What the sources report |
|---|---|
| Distance to shore (NREL 2024 report, projects through its data cut-off) | NREL: about 50 km on average for projects outside Asia, under 30 km for most Asian projects; announced projects in the United States and several European countries are under 40 km; farthest operating project nearly 115 km |
| Fixed-bottom depth (same report) | NREL: deepest operating fixed-bottom turbine in 58.6 m of water; announced projects up to 65 m; global average about 38 m |
| Floating depth | NREL’s floating reference site off the Pacific coast: 739 m |
| Legal line | BOEM: state jurisdiction usually ends 3 nautical miles out (9 off Texas, Florida’s Gulf Coast and Puerto Rico); BOEM handles offshore renewable energy in federal waters beyond |
| Site design | BOEM: depends on water depth, seabed geology and wave loading; see how much power waves carry for what wave loading means in energy terms |
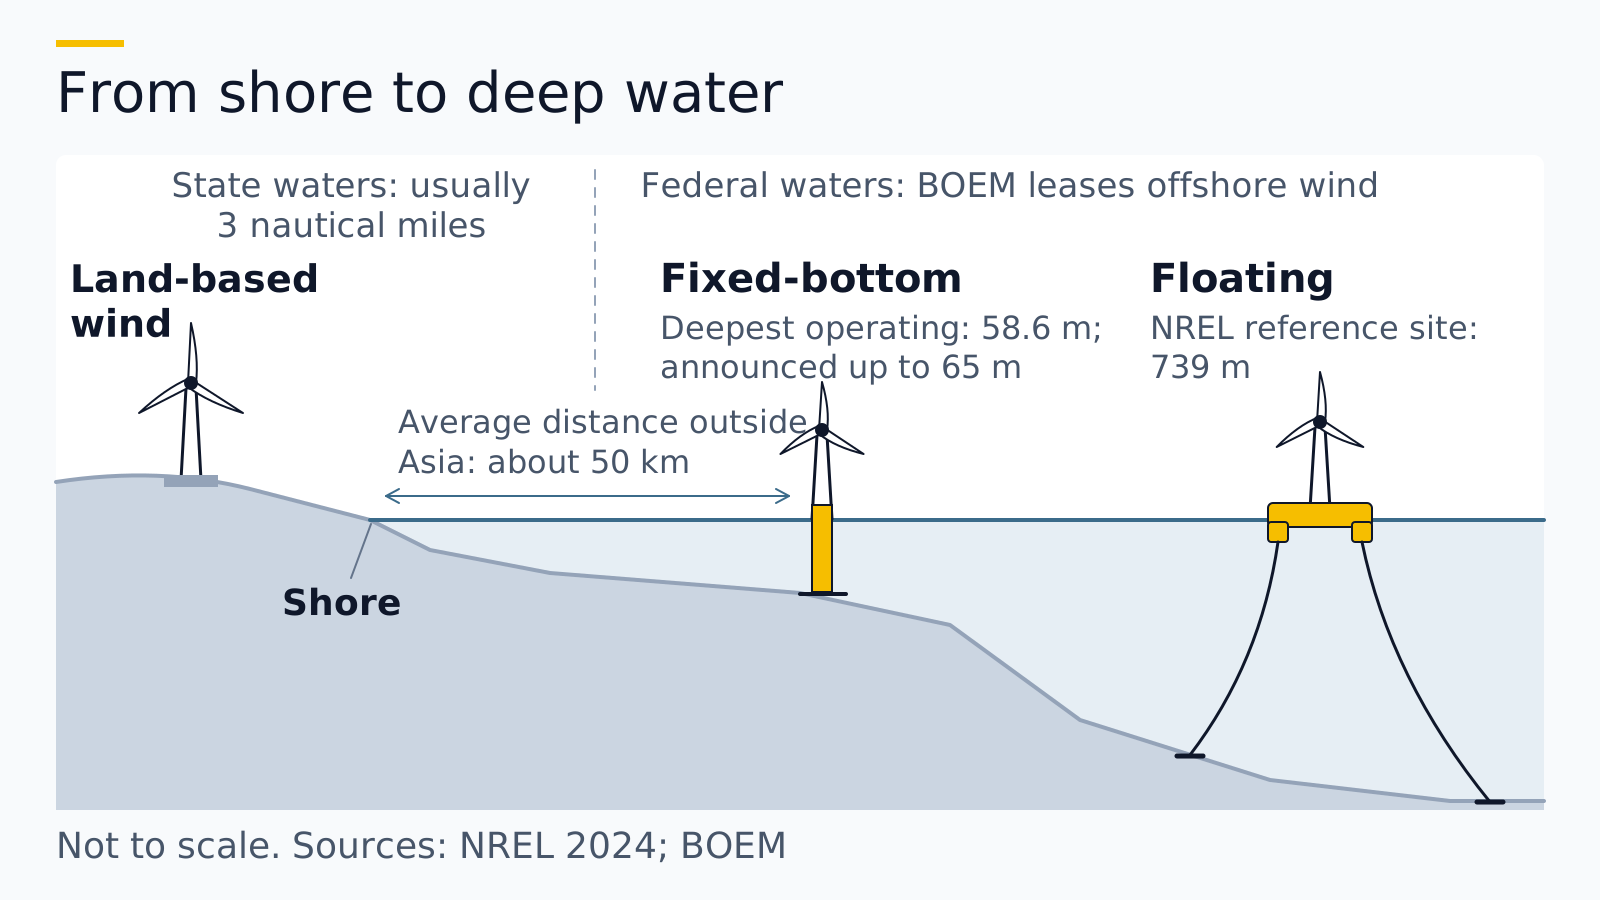
NREL’s reference cases show the split: its fixed-bottom plant sits in 34 m of water in the North Atlantic, while its floating plant sits in 739 m of water off the Pacific coast, at a site representing the first California leases.
Takeaway: Depth decides the foundation and the foundation drives much of the cost, which is why floating wind sits at the top of the cost table.
Why build offshore wind at all?
Because many U.S. coastal states have high electricity demand and little open land, and the wind at sea is strong. NREL’s 2024 market report says offshore wind enables large-scale generation near populated areas where there is not enough land for wind farms, and that siting several miles out can reduce conflicts with nearshore birds, bats and human uses. BOEM adds that offshore wind is close to major coastal load centers and offers an alternative to long-distance transmission.
| Reason given | Source | What it depends on |
|---|---|---|
| Near coastal demand where land is scarce | NREL 2024 market report; BOEM | Grid connection points on the coast |
| Stronger, more uniform winds | BOEM | Site wind data |
| Fewer conflicts with nearshore wildlife and land uses | NREL 2024 market report | Distance from shore and site-specific effects at sea |
| Larger turbines, more output per unit | NREL reference plants (12 MW vs 3.3 MW) | Ports and vessels able to handle them |
For wave energy, a younger ocean technology that shares many of these siting and survival questions, see our wave energy explainer and the rest of the wave energy section.
Takeaway: Offshore wind’s case rests on where the power is needed and how much room there is on land, not on being the cheaper option.
What are the main concerns about offshore and onshore wind?
The main concerns are cost, wildlife, fishing, coastal views and noise, and since 2025 federal policy. Onshore debates centre on birds, bats and noise; offshore debates on cost, whales and fishing. The table sets each concern beside what the responsible agencies say, without settling the debate.
| Concern | Onshore | Offshore | What official sources say |
|---|---|---|---|
| Cost | Lowest-cost wind (NREL reference $42/MWh) | Higher cost ($117–181/MWh modelled; contract prices higher still) | NREL 2024 review |
| Wildlife | Birds and bats can be injured or killed by blades | Marine mammals, especially whales | EIA (onshore); NOAA Fisheries says there are no known links between large whale deaths and ongoing offshore wind activities, while survey noise may disturb animals |
| Fishing | Not applicable | Effects on fishing communities and on NOAA’s fishery surveys | NOAA Fisheries studies both and works to keep its surveys running |
| Noise | Blade noise; some people dislike the sound | Siting several miles out can reduce conflicts with human uses near shore | EIA; NREL 2024 market report |
| Coastal views | Turbines on ridges and plains are visible locally | Turbines can be visible from beaches | BOEM environmental reviews include visual simulations from key observation points on shore |
| Materials | Blades as currently constructed cannot be recycled | Same blade issue; corrosion protection needed at sea | EIA; DNV-RP-0416 |
| Federal policy | New or renewed federal approvals paused pending review under a January 20, 2025 Presidential Memorandum | New and renewed offshore wind leasing withdrawn from January 21, 2025, under the same memorandum | The memorandum cites navigational safety, marine mammals, fishing and costs; check BOEM for the current status |
Vessel strikes and entanglement in fishing gear are, according to NOAA Fisheries, the greatest human threats to large whales; its whale FAQ also notes that no developer has applied for, and NOAA has not approved, authorization to kill marine mammals for offshore wind surveys or construction. Policy has changed quickly since 2025, so treat the last row as the text of the memorandum, not as the current state of every lease or permit.
Takeaway: Separate the question being argued (cost, wildlife, fishing, policy) and check the agency that is responsible for it before accepting either side’s claim.
Which comparison applies to you?
Start from the question you actually have; each points to a different part of this comparison and a different official source.
| If you want to know… | Look at | Primary source to check |
|---|---|---|
| Why your utility or state is buying offshore wind | Cost and siting sections; location reasons | State energy office filings; NREL market report |
| Whether offshore wind affects whales or fishing near you | Concerns table | NOAA Fisheries regional pages; BOEM environmental reviews |
| Whether a turbine produces “a lot” | Capacity factor section | LBNL land-based report; NREL cost review |
| Where turbines can go off your coast | Distance and depth table | BOEM lease and planning maps |
| What corrosion protection steel at sea needs | Maintenance section | DNV-RP-0416 (scope); our marine coatings guide |
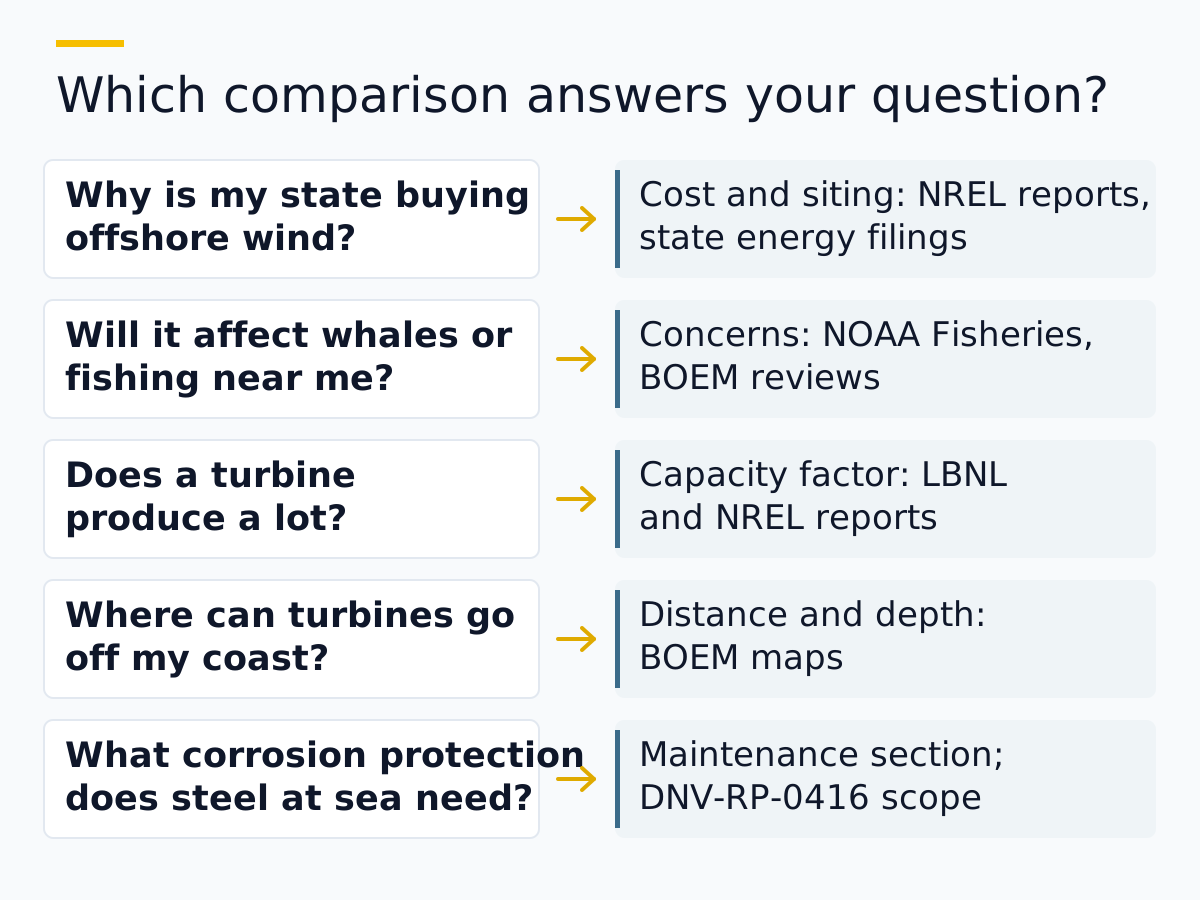
Takeaway: The useful comparison depends on your question; match the question to the responsible agency before drawing a conclusion.
When this does not apply
The cost and output figures here describe modelled plants and national fleets; they do not describe any particular project, contract or lease. Keep these limits in mind:
- Specific projects. Real projects differ in turbine, depth, distance, financing and timing; NREL warns that contract prices exceed its modelled costs.
- Other countries. The figures are U.S. reference cases; European and Asian costs and distances differ.
- Small and distributed wind. Residential and community turbines have their own costs (NREL models them separately) and are not covered here.
- Current policy and permits. Federal policy changed in 2025; check BOEM and the relevant state agency for the current position.
- Investment decisions. Nothing here is financial advice or a forecast; the About page sets out what this independent site is and is not.
Takeaway: Use this page to understand the trade-offs; use project filings and agency records for any specific decision.
Methods and sources
This comparison was compiled on October 7, 2026 from public sources: NREL’s Cost of Wind Energy Review: 2024 Edition (all cost and modelled capacity factor figures, in 2023 dollars), NREL’s Offshore Wind Market Report: 2024 Edition (U.S. data through May 31, 2024), Lawrence Berkeley National Laboratory’s Land-Based Wind Market Report: 2024 Edition (data through 2023), EIA’s wind explainers (2025 data), BOEM, NOAA Fisheries, the National Weather Service glossary, DNV’s catalogue page for DNV-RP-0416, and the text of the January 20, 2025 Presidential Memorandum. The 0.1% ratio of offshore to land-based capacity is our own arithmetic on figures with different cut-off dates. We did not test or visit any wind farm. Who runs this site is set out on the About page, and every explainer is listed on the articles page.
Takeaway: Each figure carries its source and date; check for newer editions of the NREL and LBNL reports before reusing a number.
Related reading
- Wave energy explained — How waves become electricity, with the deep-water power formula and the main device types.
- Marine paint for metal — How coating systems protect steel in the splash zone and under water.
- More offshore wind explainers — Every article in this section.