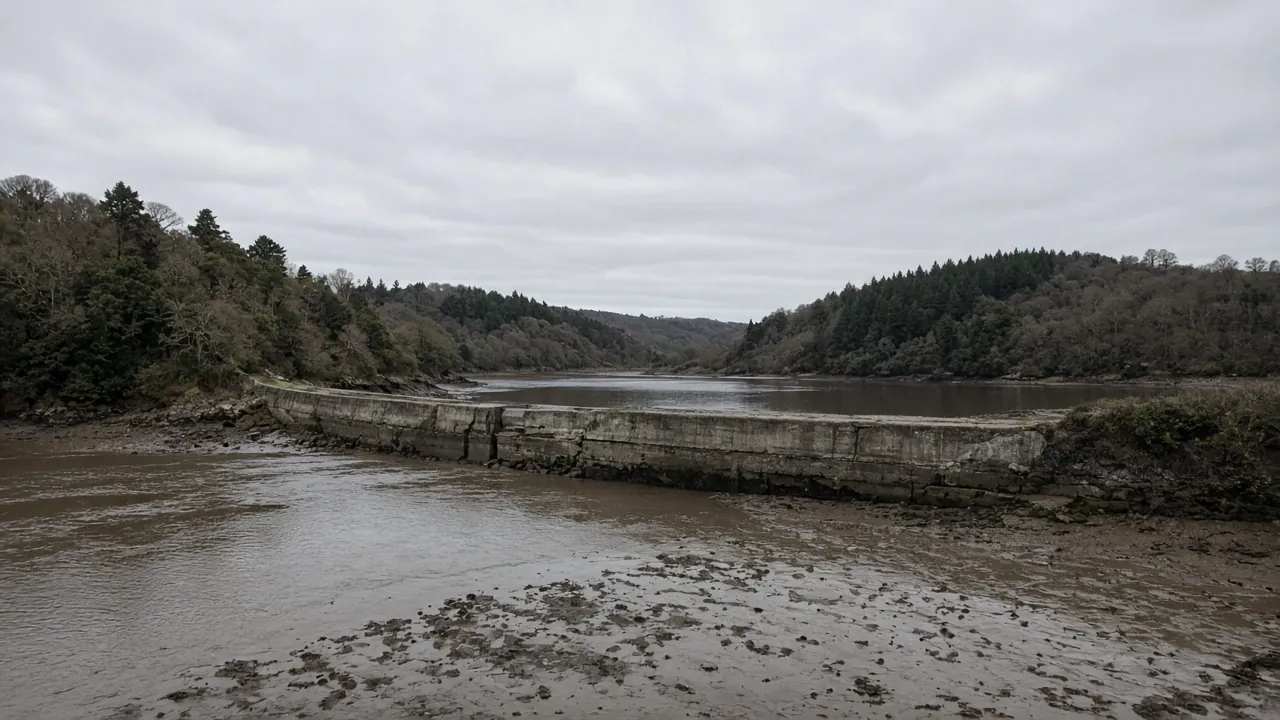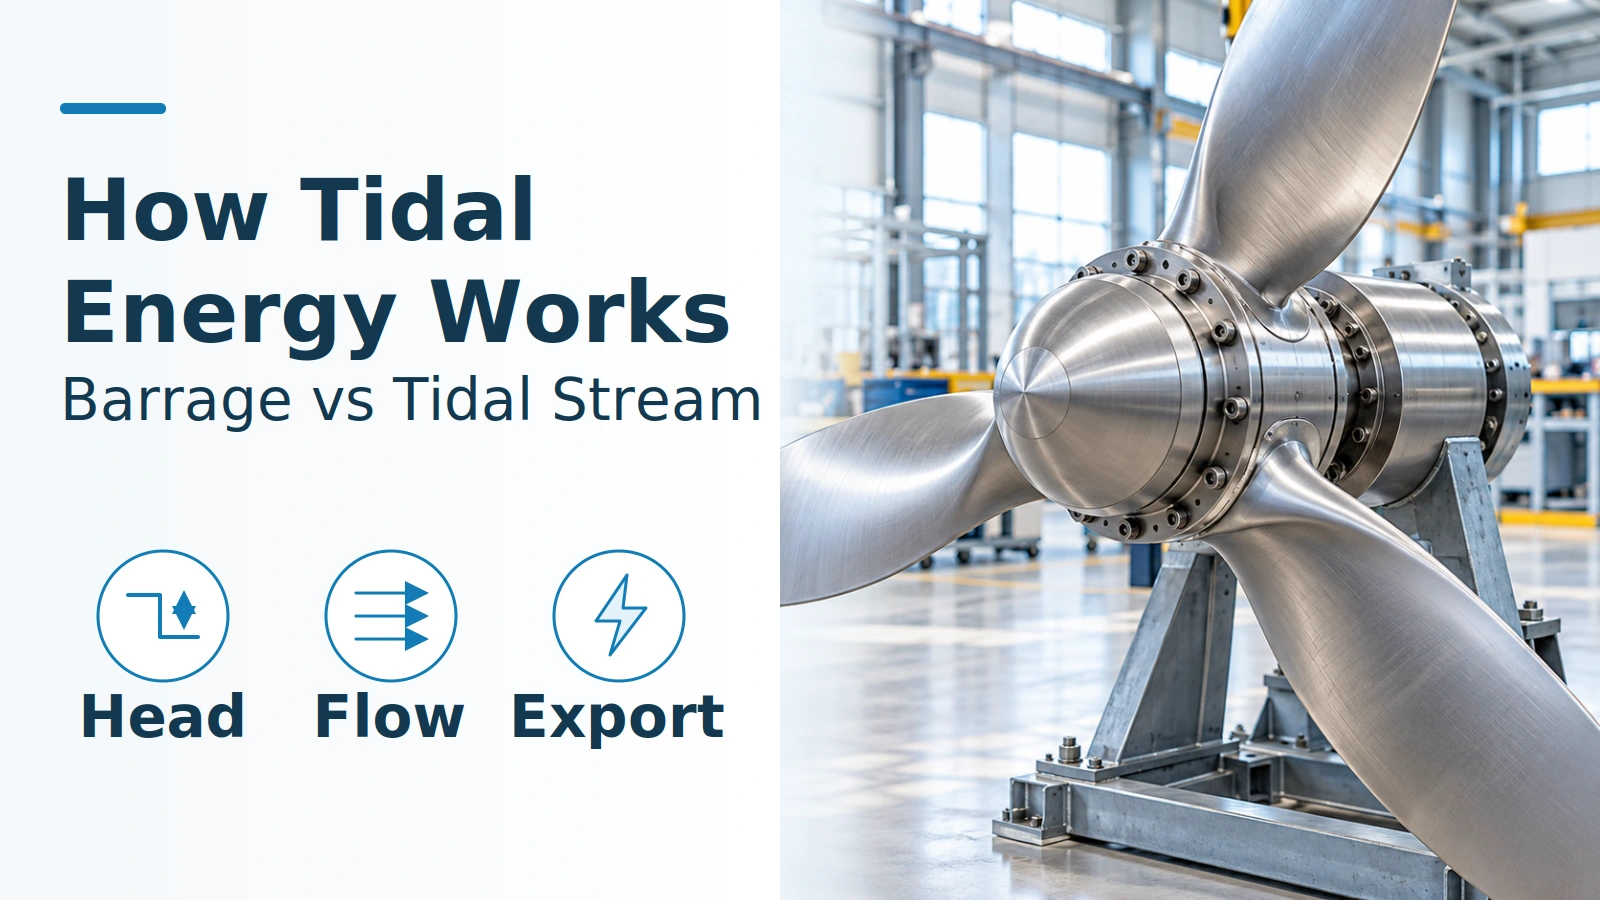
Confusing tide height with current speed can turn a predictable tide into an overstated electricity estimate. How tidal energy works depends on the mechanism: a barrage converts the water-level difference across an impounded basin, while a tidal-stream turbine converts the kinetic energy of passing water.
A barrage holds water while the sea level changes, then releases it through turbines when the head permits generation. A tidal-stream device lets the tide flow past a submerged rotor, which drives a generator. Both need the right operating conditions: a barrage has holding and filling phases, and a stream turbine has little or no available power around slack current. Generating electricity also requires functioning machinery and an available electrical connection; knowing the tide’s timing does not make output continuous.
- Barrage input: instantaneous head between basin and sea.
- Stream input: current velocity through the capture area.
- Useful output: electrical power at a stated device or shore measurement point.
What changes between a barrage and a tidal-stream turbine?
The difference is stored head versus passing current. EIA’s tidal-power explanation describes a barrage with a controlled basin and stream turbines whose blades turn a rotor and generator. FORCE makes the same potential-energy versus kinetic-energy distinction. Both sources were reviewed on October 19, 2026.
Scroll the table sideways on narrow screens.
| Input or item | Tidal barrage | Tidal-stream turbine |
|---|---|---|
| Physical input | Water-level difference across the structure | Velocity of water passing the device |
| Main components | Basin, embankment, sluices, turbine passage and generator | Rotor, drivetrain/generator, support and electrical connection; arrangement varies |
| Generating trigger | Head and flow inside the turbine’s permitted operating envelope | Current inside the device’s generating envelope |
| Normal pause | Holding to build head; filling or equalizing without generation | Slack current or speed below the device’s cut-in condition |
| Dominant Failure Mode & Prevention | Loss of intended head/flow sequence through incorrect gate or turbine transitions: evaluate level/head sensing and coordinated controls | Loss of capture/export through mechanical degradation or electrical faults: evaluate condition monitoring, corrosion protection and service access |
The failure row identifies physical risks to control, not measured rankings of the most frequent faults. The barrage control risk follows from the operating sequence below; the stream maintenance considerations follow EMEC’s 2009 reliability guidance.
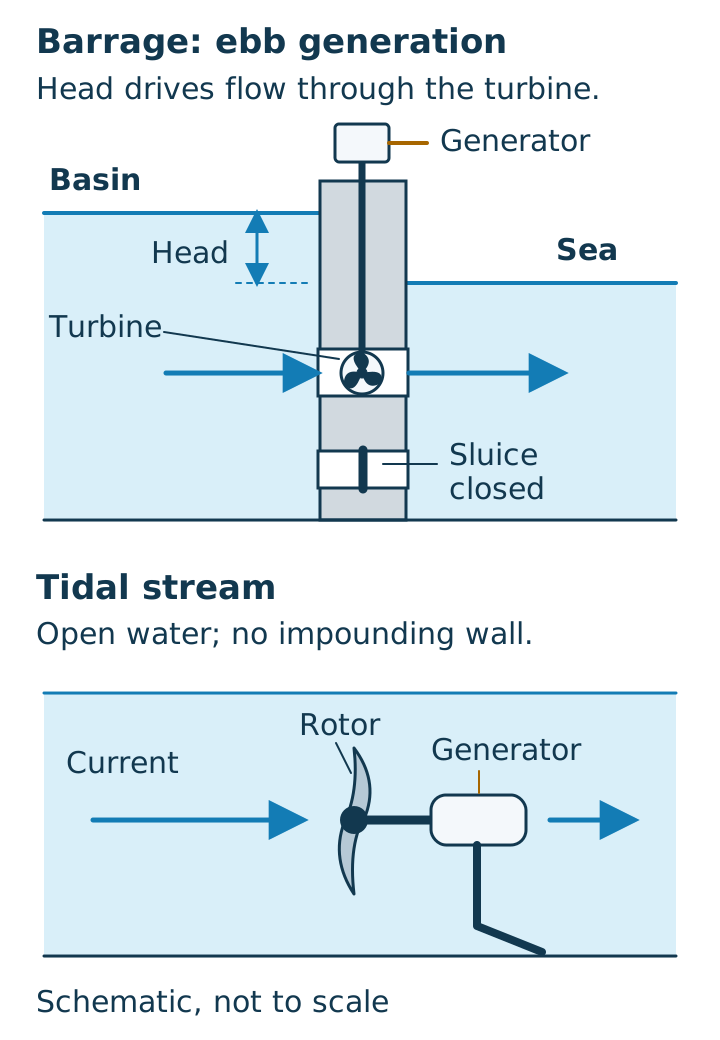
Tidal range is the difference between high and low water over a tide. Head is the difference between the two sides of the barrage at one instant. A large range does not establish the head available at every moment. A tidal lagoon also impounds water; a tidal fence is a row of turbines with water passing through, rather than necessarily a sealed basin. The broader distinction from wind-driven surface waves is covered in wave energy versus tidal energy.
How does a barrage generate through a tide?
A barrage generates when water crosses its turbine passage under a usable head, turning a runner coupled to a generator. Its sluices provide a separate route for controlling basin level and exchanging water; flow through a sluice does not by itself produce electricity.
For ebb-only generation without pumping, Xue, Ahmadian and Falconer’s 2019 paper describes this sequence in section 2.1:
- Hold near high water. Close the turbines and sluices. The sea falls while the basin retains water, building head.
- Generate on the ebb. Open the turbine path once the starting-head condition is reached. Water flows from basin to sea through the turbines.
- Stop and hold. End generation when head becomes inadequate; close the passages while the sea begins rising again.
- Fill on the flood. Once sea level exceeds basin level, open sluices and turbine passages without generating. Near equal levels around high water, close them for the next cycle.
A two-way system adds generation with sea-to-basin flow. After ebb generation, sluicing brings levels near equal; closing the passages then lets the rising sea build head in the opposite direction. Flood generation starts at its own starting-head condition, stops at its ending condition, and filling/equalization precedes another ebb-holding phase. Those are the paper’s simplified no-pumping modes, rather than instructions for operating a particular plant.
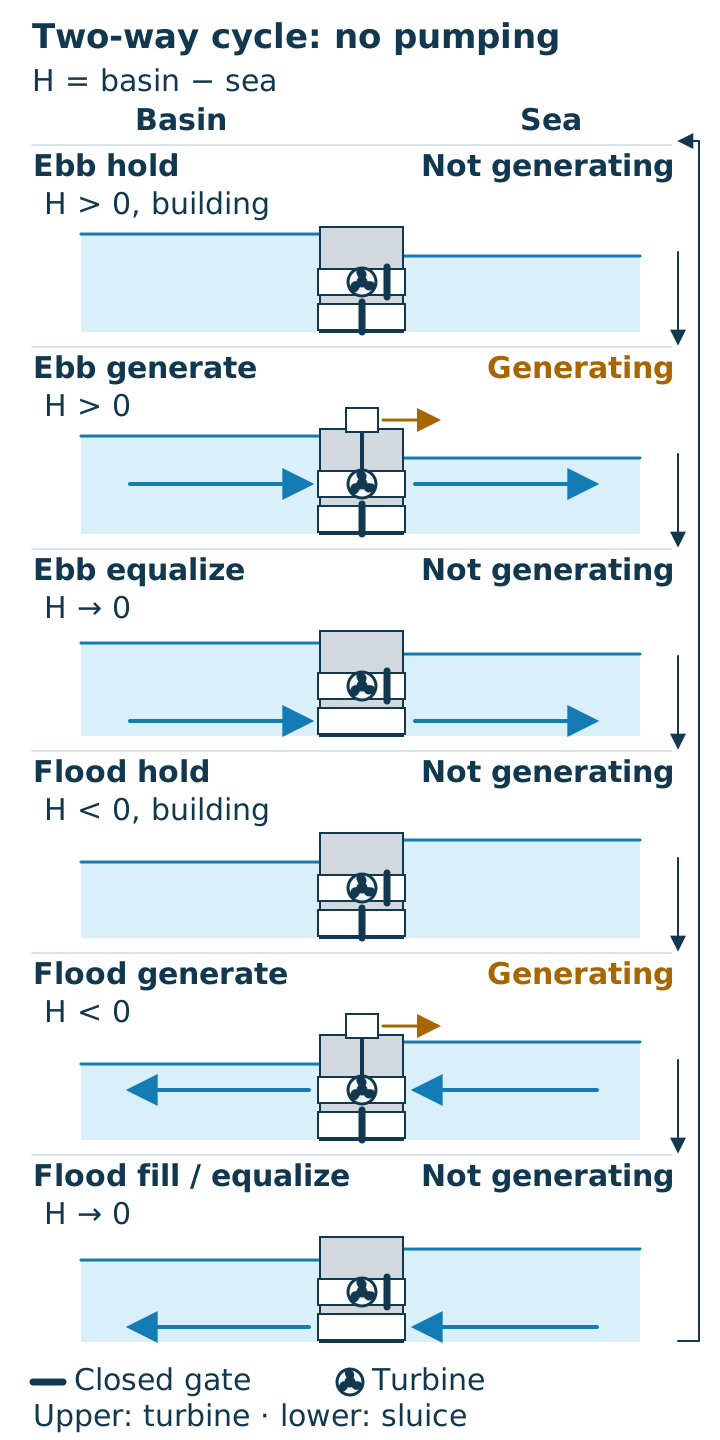
Two-way generation therefore still has pauses. It changes which parts of the tidal cycle can generate; it does not make every gate opening a generating event.
How does a tidal-stream turbine turn flow into electricity?
A representative horizontal-axis turbine extracts energy as moving water turns its rotor and the rotor drives a generator. It does not need a barrage to retain a basin of water. Its support holds the energy-capturing device in the current; support and electrical equipment must accommodate the particular design.
Flow reverses during a tidal cycle, so the machine needs a design compatible with its intended directions of operation. The method is device-specific: do not assume every rotor reverses pitch, every machine yaws, or every drivetrain has a gearbox.
Horizontal-axis turbines are one family. EMEC’s tidal-device descriptions also include vertical-axis turbines, oscillating hydrofoils and tethered kites. A floating support carrying submerged stream rotors still captures current energy; floating alone does not make it a wave-energy converter.
When can either system generate?
Each system can generate only inside its own hydraulic and electrical operating envelope. High water alone is insufficient evidence for either mechanism.
Rule of thumb — barrage head: At zero head, there is no head-driven generating power. For a selected operating direction, hold until its starting-head condition is reached and end generation at the specified stopping condition. In the validation setup reported by Xue and colleagues in 2019, ebb generation used a 3.0 m starting head and 1.0 m ending head. Those are that model’s inputs, not universal thresholds or measured settings for a current plant (paper, page 5).
Rule of thumb — stream velocity: At 0 m/s current, available kinetic power is zero. Nonzero current below a particular device’s cut-in speed still does not establish electricity production. Positive cut-in and upper operating limits must come from the device’s documented power curve and controls; there is no single supported startup speed for all tidal turbines.
Use local current conditions at the rotor rather than assuming slack water always coincides with local high or low tide. For interpreting device curves and output ratios, continue to tidal power efficiency and its measurement boundaries.
Why does current speed matter so much?
Available kinetic power increases with the cube of current speed, provided water density and capture area stay fixed. EMEC’s 2009 performance guide gives the relation in section 7.1, equation 1:
P_available = ½ × ρ × A × v³
Here, ρ is water density in kg/m³, A is capture area in m², and v is the capture-area-representative current velocity in m/s. These SI inputs give power in watts. A single surface-speed observation need not represent the flow over the whole rotor.
Worked example: With density and area unchanged, doubling current speed gives P_available(2v) / P_available(v) = (2v / v)³ = 2³ = 8 times the available power, for nonzero v.
That arithmetic is the available-water-power relation, not a promise of eight times the electrical export. Device losses, power-curve shape, rated limits and control actions still apply. The public abstract of IEC TS 62600-200:2013 identifies tidal-current converter performance assessment, rated power/velocity and power-curve methods as its scope. It does not supply a universal cut-in speed.
How does power reach shore, and what belongs in the cost ledger?
The generator feeds an electrical connection that carries power toward shore and the grid, with losses between measurement points. A conceptual stream-device path is rotor → drivetrain/generator → electrical conditioning and protection → export cable → shore/grid interface. The equipment, voltage, AC/DC arrangement and location of conditioning depend on the design.
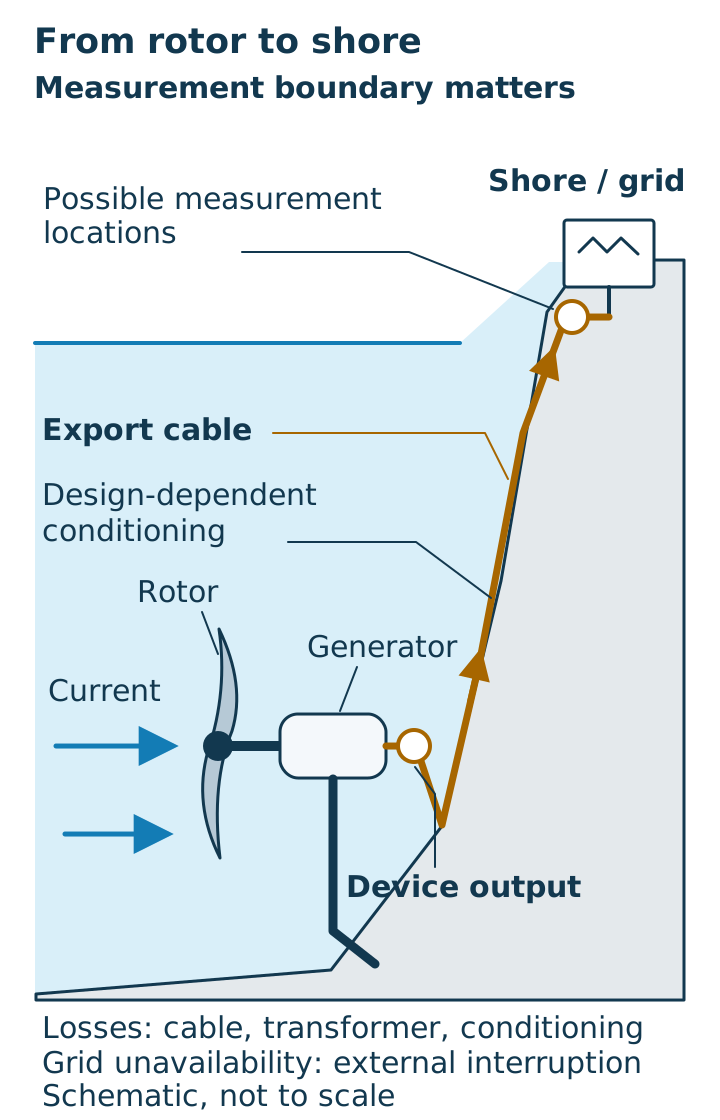
EMEC’s 2009 performance guide, section 7.2.1, distinguishes recorded power at the device output from measurement at an onshore substation. Cable, transformer and conditioning losses must be accounted for when comparing those boundaries.
A zero-output period also needs a cause. Normal holding or weak current is different from a device fault, planned service or a grid outage. Section 5.4 of that guide explicitly separates device faults, planned maintenance and third-party/grid unavailability; no power by itself is an inadequate availability signal.
For total cost of ownership, retain those distinctions in a lifecycle ledger. The categories below are an engineering accounting structure, not project cost estimates.
Scroll the table sideways on narrow screens.
| Hidden cost or lost operating time | Record separately | Why the mechanism makes it relevant |
|---|---|---|
| Sensing and control upkeep | Inspection, calibration and fault-finding effort | Barrage state changes depend on head; stream operation depends on current and device status |
| Corrosion protection and inspection | Inspection access, protection renewal and repair work | Submerged steel, supports and connections remain exposed even during normal generation pauses |
| Access and recovery | Vessel/retrieval work and waiting for a suitable weather/current window | A short repair can require a much longer calendar outage |
| Component repair and recommissioning | Actual service hours, replacement work and return-to-service checks | Repair effort and lost operating time are different ledger entries |
| Export interface | Cable, connection and conditioning work; external grid downtime | A healthy rotor cannot deliver through an unavailable export path |
Assumed downtime example (not project data): For consecutive, non-overlapping stages, calendar outage = access-window wait + repair + recommissioning = 12 h + 2 h + 1 h = 15 h. Recording only the 2 h repair misses 15 h − 2 h = 13 h of elapsed outage. Log start and finish times so overlapping activities are not counted twice; crew labor-hours belong in a separate entry.
Those 15 h are not necessarily 15 generating hours. To estimate lost electricity, use E_lost = ∫ P_net,expected(t) dt over only the outage intervals when the system would otherwise have generated, with expected net power in kW at a stated measurement boundary and time in hours, giving kWh. Exclude normal holding, filling and slack-current pauses; assign overlapping fault, service and grid interruptions once. The assumed time inputs alone do not establish lost kWh or revenue.
EMEC’s 2009 reliability guide addresses corrosion, fatigue, foundations/moorings, cabling and weather windows. Orbital’s public technology page, retrieved October 19, 2026, gives a manufacturer example of designing for access during through-life servicing. It supports treating access as a design consideration, rather than assigning every tidal machine the same service method or cost.
For the physical protection interfaces, read marine cathodic protection and marine paint for metal. For ecological questions arising from basin control, turbine movement or export infrastructure, use the separate tidal energy environmental-effects analysis.
Methods and sources
Updated October 2026. This explainer combines EIA and EMEC mechanism descriptions, the no-pumping operating modes in section 2.1 of Xue, Ahmadian and Falconer (2019), and the specifically identified sections of EMEC’s 2009 performance and reliability guides. The head settings are dated model inputs; the velocity ratio is arithmetic on the published kinetic-power equation.
IEC TS 62600-200:2013 is cited only within its public abstract’s scope, not unread specification clauses. OEM material supports a servicing-access example. These sources establish neither a site’s output nor a universal equipment configuration. Full references follow; return to the ocean energy articles for the wider coverage.